Sunday, December 9, 2012

December 7 Weekend Update

.
Although the fiscal curb/cliff is keeping us locked in a range, it appears that we're on track as far as our allocations are concerned.

The following is a snapshot of allocations vs. balances for my wife's TSP account:


The chart on the right shows the allocations as of our latest signal, and the chart on the left shows what has actually happened since the last signal.

Bottom line, the I-Fund is dead-on in terms of overall percentage of allocation, F-Fund has been slipping, as I would expect in an appreciating market (albeit, weakly appreciating), and the C-Fund and S-Fund have been growing a bit more than my algorithm projected.  Nevertheless, I'm fine with the present allocations and will not make any changes at the present time.

Unless I get a signal to the contrary (always possible), I will leave these allocations until the end of the month.

Regards,

pgd

Saturday, December 1, 2012

Allocation Change Effective Monday, December 3

.
Effective with the close of markets on Friday, November 30th, my GGT TSP model has signaled a transition.  Note that NOT ALL FUNDS have signaled a move, so this one is suspect and failure is possible.

My new allocations are:

Aggressive Portfolio

F-Fund:  24%
C-Fund:  14%
I-Fund:  42%
S-Fund:  20%

Conservative Portfolio


G-Fund:  56%
F-Fund:  24%
S-Fund:  20%


I am following the Aggressive Portfolio.

The two funds under the Aggressive Portfolio that did not indicate transition are C-Fund and I-Fund.  They are close to transitioning, but no cigar.  Hence, if I were to follow the conservative portfolio and invest in these when/if they transitioned in December I would use the 2x chances we get to invest in a given month, and if we move to cash (we always seem to do this around the 14th of December), we would miss any potential Santa Clause rally.  I am choosing not to do this.

These changes will be in place by the close of business on 12/3 if I make the change request prior to noon EDT.


Since 11/25/08, which is when this model started, the following statistics have been generated:


As always, you are responsible for your own investment decisions, and I am not.  Please do your diligence, and please take ownership for your actions.

Regards,

pgd

Sunday, November 18, 2012

Cash Signal Intact as of Close of Friday, November 16

.
By most common measures the markets are oversold and we should be considering entering.  Nothing at this point is indicating that we should move in, and with a short week due to Thanksgiving, I anticipate lower demand in the markets which will cause a general drift of prices.  The analogy is a sailboat without a keel -- you can go a specific direction, but you may also do it sideways ...

Since the sell signal that was effective with the close of November 2nd and which we could have acted on with the close of prices on the 3rd, we have the following market performance:

F-Fund (bonds):  Up +0.18%
C-Fund (mimic S&P500):  Down -3.87%
S-Fund (mimic small cap stocks):  Down -4.46%
I-Fund (mimic international index): Down -2.70%

We've been in cash so we've edged up a whopping +0.04%, which does not keep up with inflation in case you were wondering.  This is better than losing the amounts above, so net-net, we're up on this particular call.

The broad markets peaked on September 14th -- easy to know in hindsight, impossible to know when you're in the middle of the forest.  Since that time we have had the following market performance:


G-Fund (cash): Up +0.23%
F-Fund (bonds):  Up +1.18%
C-Fund (mimic S&P500):  Down -6.87%
S-Fund (mimic small cap stocks):  Down -8.11%
I-Fund (mimic international index): Down -5.44%

Obviously the call to cash on October 10th, a move back into the 16th, and the call to cash on November 2nd helped save some capital, but we did lose some ground compared to November 2nd close:


The trades on November 5th were for a loss, lowering system performance across the board.  Our actual numbers are different than what is above because the above values assume 25% in each fund and in reality, I provide guidance on allocations that I use which are different than 25% in each fund.

If you are not owning a government-sponsored retirement fund but want to proxy into using exchanged traded funds (ETFs), there is a parallel universe:  GGT, using liquid ETFs that mimic the S-Fund (VXF), C-Fund (SPY), I-Fund (EFA), and F-Fund (AGG) has a better behavior overall for the past year, but note that the system is solidly in cash with the exception of the F-Fund (AGG)/bonds, which did signal long back on November 8th at an execution price on November 9th of $16.0324 (F-Fund) and limit buy of $112.14 (AGG).  F-Fund closed at $16.0348 on November 16th, for a gain of +0.01% (yes, 1/100th of a percent), and AGG at $112.21, for a gain of +0.06%.

In my view being long in bonds (F-Fund or AGG) is hardly worth the effort.  They can't go much higher in value since rates are so low.

Here's GGT's view of the TSP proxy ETFs:


Right-click on the image to open it in a new tab or window.

Most short-term market corrections fall in the 4-6% range.  We're a bit below that in the C and S funds, so to state that we're going to get a rebound and set new highs in the market is too optimistic.  I expect a rebound off the bottoms here, but I also anticipate possibly not entering into the markets until December.

I'll send notes out to the board if the behavior changes.  I'm watching both the GGT system and my independent TSP timer on a daily basis, and will post any relevant behavior.  Don't rely on me though -- do your own diligence, subscribe to my dropbox folder to get the ETF status on a daily basis, and you can make your own decisions without me posting here.

Regards,

pgd

Monday, November 5, 2012

Signal Change as of November 2nd Close

.
Effective with the close of markets on Friday, November 2nd, my GGT model that I apply to the Thrift Savings Plan has transitioned to CASH for the equity markets and a limited position in the F-Fund.

If the dollar strengthens, as I expect it will, I would expect the F-Fund to continue to appreciate (up +0.1% over the last 30 days).  Correspondingly, the aggressive portfolio will see a position in the F-Fund and the rest of the monies will be in cash.

For the conservative portfolio, everything is in cash (100% G-Fund).

Allocations are as follows:

Conservative:  100% G-Fund

Aggressive:  39% F-Fund, 61% G-Fund

I do note that there is not a significant change of money flow into AGG, which is the proxy for the F-Fund (they both track the same index).  I would like to see prices of AGG remain low while there is "stealth" buying, and this is NOT the case right now:

From www.effectivevolume.com:


The top chart shows that average money flow has been OUT (institutionals are net sellers, not buyers), but the bottom price chart shows that we are at the bottom of a local range so there is a potential to move upward.  I would like to see, in the top chart, that total effective volume be above the 20-day moving average, and more importantly, that the slope of the 20d MA be positive (it is presently negative).

Metrics through November 2nd, 2012, based on TSP closing data started on 11/25/08, and using the rules of the TSP are as follows:


The performance numbers will be slighting different, as the table above assumes 25%-25%-25%-25% allocation in each fund, and I actually allocate using momentum over the last month.

Make your changes by noon Monday, November 5th and they will be applicable the evening of Monday, November 5th.

I am moving 100% to cash (G-Fund).

Remember, you are responsible for your own investment decisions, and I am not.  Please do your own diligence, and please take ownership for your actions.

Regards,

pgd


Wednesday, October 17, 2012

Signal Change as of October 16 Close

.
Although I loathe rapid signal changes in any equity timing system, especially during a week of options expiration, I'm compelled to follow the signals generated by my indicators as they are typically better at moving me into and out of the market than I am at discretionary trading.

Correspondingly, although my concern is higher at the present time for being in the equity markets, I am generating the following changes:

Conservative Portfolio:

C-Fund:  25%
I-Fund:   26%
G-Fund:  49%

This conservative portfolio gives us some exposure to equities but protects us on the down side by keeping a good portion in cash (G-Fund).  Note that nothing is allocated to the F-Fund (bonds) and nothing is allocated to the S-Fund (small capitalization companies).  This is because they have not moved up aggressively as the C-Fund (large cap) nor the I-Fund (international index).

Aggressive Portfolio:

C-Fund:  42%
I-Fund:  44%
G-Fund:  14%

The aggressive portfolio is just that.  I see no compelling reason to allocate to the S-Fund at the present time.

I will be allocating to the CONSERVATIVE PORTFOLIO with the close of markets on 10/17.

Regards,

pgd

Thursday, October 11, 2012

Signal Change for October 10, 2012

.
With the close of markets on Wednesday, October 10th, my TSP models have confirmed a 100% move to cash.

I will transfer 100% of my holdings to the G-Fund, effective with the close today.

Regards,

pgd

Friday, September 14, 2012

Pending Travel and Implications

.
All,

I am going to be unavailable to evaluate signals from Thursday, September 20th through Wednesday, October 4th, as I will not have access to the internet for nightly downloads.  This means that I will not be able to notify you if we get a sell signal until after my return.

This obviously leaves a few options for me:

1) Do nothing with my wife's TSP portfolio.

This is probably not a bad approach -- I anticipate that although the road ahead will be rocky between now and The Election, the overall trend is most likely upwards.  My time horizon is still far off before we can tap these monies, so we have lots of time to make up losses if they occur while I'm gone.  This is my preferred approach going into the weekend.

2) Move the TSP portfolio 100% into the G-Fund (cash), and do the same with future contributions.

This is the safest approach, but not necessarily the most prudent.  The issue here is that as the market climbs higher, we'll miss any chance of appreciation since the interest rate on the G-Fund is practically 0%.  The positive with this approach is that there is virtually no chance of losing ground, and the gains since 9/5 (about 4-5%) will be locked in.  I certainly can add back to the account once I return.

3) Move the TSP portfolio holdings to 100% G-Fund, but keep future contributions working.

This isn't a bad approach overall.  This ensures that the gains to date are locked in and if the markets continue higher, any new money will move higher with it.  The downside is that if the markets move higher the amount of gains lost will dwarf anything gained by future contributions (because the base value of the account is considerably higher than the individual contribution).  The upside to this approach is the same as 2) in that gains to date are protected.

4) Move a % to cash and leave the rest to work.

I think that this is the most prudent choice if I don't do 1).  It protects some of the gains to date and limits the losses on the downside.

Please evaluate your personal situation and make your choice as it best suits you.

Regards,

pgd

Wednesday, September 5, 2012

Reaffirming Long Entry for Sept 5th

With the close of markets on September 4th, my models have indicated that I should move long into the three equity funds (C-Fund, I-Fund, S-Fund).

My allocations are as follows:

C-Fund:  23%
I-Fund:  14%
S-Fund:  63%

If I make the exchange prior to noon on 9/5 the transaction will complete with the end-of-day prices on 9/5.

I have already made the transfer request.

As with all of my postings, you are responsible for conducting your own diligence.  Please take personal ownership for your investment actions.

Regards,

pgd

Monday, July 16, 2012

Whipsaw Signal -- Moving Back to G-Fund

.
With the close of markets on Friday, July 13th, the TSP models are signaling a move to G-Fund.  This is a short-term whipsaw and is due to the failed breakout of the C-, S-, and I-Funds from the previous signal.  Volatility is on the rise, but prices are not, and this divergence has historically not been favorable over the long term.

Effective immediately, I am transitioning back to 100% G-Fund and due to the 2x / month change rule, will be here for the remainder of the month.  If today is not too bad in terms of close we may exit this trade near -0.6% for C-Fund, +1.2% for S-Fund, and -1.5% for I-Fund.

Cash (G-Fund) is king.

Regards,

Paul

Friday, July 6, 2012

Unconfirmed Signal Change Effective 7/6/12

.
With the close of markets on 7/5/12, we have an unconfirmed signal change for the Thrift Savings Plan allocations.  "Unconfirmed" means that the long-term timer is not yet confirming this move, but short-term and intermediate-term timers have now indicated we should be back in the market.

Correspondingly, holding 50% in cash could be prudent, as we could fail this signal.  Summer is typically not a strong period to initiate new long-term trends, so I am not overly optimistic.  Your crystal ball is as good as mine though, and I am compelled to follow my rules.

Aggressive:
C-Fund:  32%
I-Fund:  30%
S-Fund:  38%
G-Fund:  0%
F-Fund:  0%

Conservative:

C-Fund:  16%
I-Fund:  15%
S-Fund:  19%
G-Fund:  49%
F-Fund:  1%

If you make the change before 12:00 EDT the funds will be transferred this evening.

Again, remember that this is not a recommendation to buy/hold/sell.  This model is presented for your education and consideration.  You are responsible for your own actions.  Please do your own diligence in making any decisions.

Regards,

pgd


Saturday, May 5, 2012

Update for Monday, May 7th -- Move to G-Fund

This has not been a productive investment cycle, but that obviously is done with hindsight.  We never know where the next signal is coming from, so remember that we are compelled to follow the model as long as it performs well over the long haul.

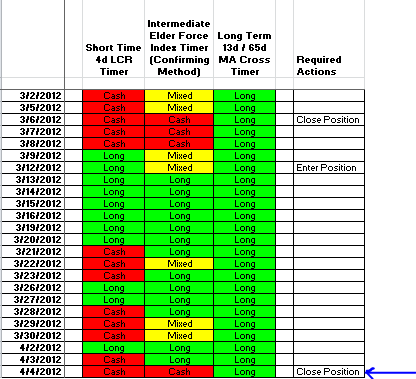
With the close of markets on Friday, May 4th, the GGT/TSP model has signaled that we should close all positions and move to a combination of G-Fund and F-Fund.  I simply think bond-risk isn't worth the trouble, so I'm moving everything to G-Fund for now.


As with all my images, right-click on the picture to open in a new tab or window.

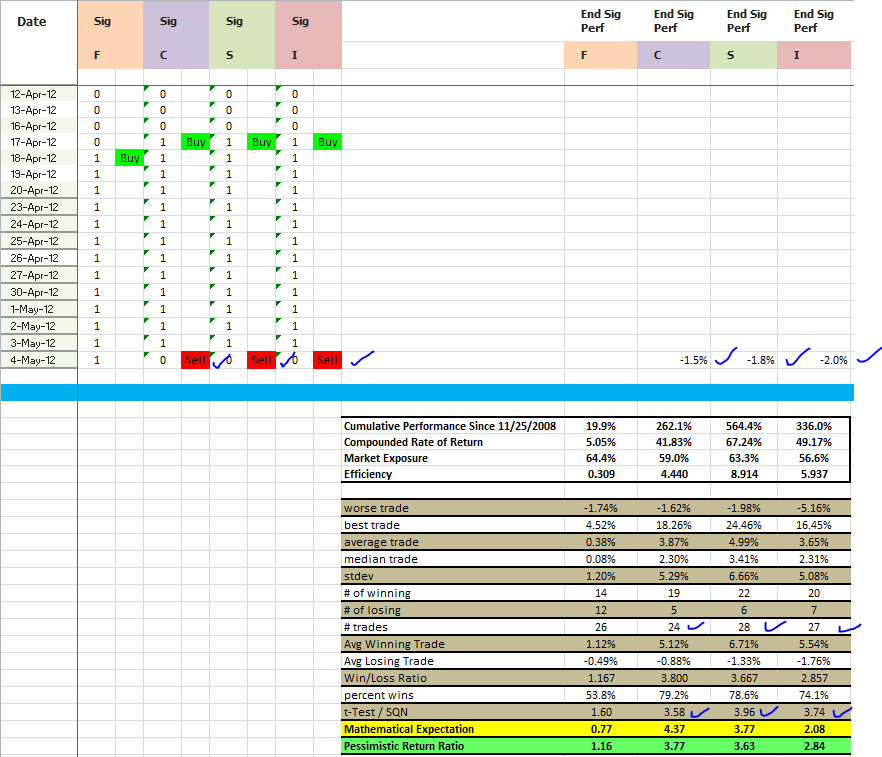
As you can see in the upper right area, this last sequence since the last buy signal has not been positive.  The actual amount lost will be a function of Monday's behavior -- if it's up the losses will be slightly less than shown, if Monday's markets are down we will record a greater loss.

The table shows that over the long haul, e.g., since 11/25/08, the model has been quite productive and accurate.  This is my "new" model which I recently improved (substantially) from the previous one which missed the December/January signals.  This model also has a different set of metrics which are independent, so I can watch behavior on multiple inputs and ensure that we're behaving the way we expect to.  To date I have not been able to develop an independent model which outperforms the statistics above.

The F-Fund, which is a bond fund, has the "worse" performance overall and is shown on the left of the table stats.  The model's signalling engine is based in stocks, not in bonds, and it goes to reason that timing bonds with stocks is probably not a good thing in the long haul.  Before we discount the F-Fund all together, note that overall, it does perform "okay" for a bond (low-volatility, low risk) vehicle, so it can play a role in our strategy if we decide it should.  Note that I personally do not use the F-Fund in my allocations, as I am an aggressive investor.

The C-, S-, and I-Fund statistics are all quite compelling.  The Compounded Rates of Return (CRR) for the three range from 41% to 67% over the past 3.5 years.  The model has us invested between 56% and 63% of the time to produce those returns, so you can see that it is quite efficient (keep our powder dry when the model says to stay away).

Although equity and gains are what we bank and what we retire on, equity/gains are not the entire picture.  The 3 metrics at the bottom:  t-Test/SQN, Mathematical Expectation (ME), and Pessimistic Return Ratio (PRR) are all methods to quantify the robustness of the model, and they specifically check to ensure that the model does not lock in big losses relative to the wins it captures, and it rewards a greater number of trades, such that the more consistent the trades over time, the better the metrics.

t-Test/SQN is a methodology developed by Van K. Thorp and basically tests whether we are outperforming the null hypothesis, e.g. are we better than chance.  From an empirical viewpoint, we want this value to be above 1.7 with the number of trades well above 20-30, but with a model such as ours (restricted to 2 trades / month), it will take some time to develop numbers way above 20-30.  As you can see the number of trades in the C-, S-, and I-Funds are in the 24 - 28 range, which is just becoming statistically significant.

Mathematical Expectation is the "edge" of the system.  In Vegas, the edge for the House is generally positive with all games except video poker, which is a loss-leader to get you deeper into the casino.  This means that when you throw lots of people with money at their games, they will win in the long haul.  ME values need to be positive for any system over the long haul, and values above 0.5 or so are good systems.  Dr. Diliddo of VectorVest fame regularly produces ME values in the 0.3 - 0.8 range on portfolios that return a positive CRR over a year, so we don't need values as high as shown.  I've rechecked the math and the values shown are not in error -- the TSP model produces very good results consistently, and consistency is rewarded in higher ME values.

Pessimistic Return Ratio (PRR) is also the "edge" of the system, but calculated very differently than T-Test or ME.  If we had an infinite number of trades (we won't live long enough), the PRR will converge on a number called the Profit Factor, which you will find in many brokerage reports on your trading performance.  Profit factor completely falls apart if the number of trades is low, hence, PRR is better because it considers the number of trades in the system AND it weights wins/losses accordingly.  We want values above 1.0 here and values above 2.0 - 2.5 are considered good systems.  We want the number of trades to be larger than 24 when looking at PRR, and you can see that we just hit that threshold with the C-Fund.

In the end, I'm moving my funds to cash, effective with the close of markets on Monday, May 7th.

Regards,

pgd

Thursday, April 26, 2012

Signal change for Thursday, April 26th

.
With the close of markets on Wednesday, April 25th, my TSP models have signaled a transition from cash to invested.

NOTE:  This is not investment advice.  You are responsible for your own actions and I am not.  Please do your own diligence and please take ownership for your actions.

In the conservative portfolio, the model is suggesting the following allocations:

F-Fund:  38%
C-Fund:  30%
I-Fund:  10%
S-Fund:  22%

Substituting the G-Fund for the F-Fund is also a safe and prudent action.

In the ggressive portfolio (longer than 10 years before needing the monies), the model is suggesting the following:

C-Fund:  49%
I-Fund:  17%
S-Fund:  34%

Changes made before noon will be effective at the close.

I intend to transition to fully invested using the aggressive portfolio.

For you folks who like statistics, I've updated the model to be consistent with my other models and have the following table:


The four TSP funds are listed across the top.  This is a table which uses the actual closing prices of the TSP funds, and the model accounts for transfers that are made the following night AFTER a signal.

Of importance is simply that we have a "good" number of trades in each fund and the statistics get us in the ball park.

In general, the I-Fund, which is an international fund, has experienced the worse loosing trade.  Note that the average losing trade is the worse with this model.  Certainly not bad, but simply the more volatile of all the other funds.

The F-Fund is the weakest performer, not in terms of equity, but in terms of metrics.  The t-test/SQN value of 1.60 is below minimum of 1.7 and suggests that the model is not in sync for the bond fund.  This is probably true, because the underlying engine is equity-based, not bonds.  Timing bonds with equity movements doesn't always work out in our favor.  Hence, a strategy here is to presently substitute the G-Fund for F-Fund and remove all bond risk.

Regards,

pgd

Wednesday, April 4, 2012

Update for Thursday, April 5th -- Moving to Cash

With the close of markets on Wednesday, April 4th, my intermediate-termed timer has transitioned to CASH.  I am moving 100% of my monies to G-Fund, effective with the close of markets Thursday.

Conservative Allocation:  G-Fund:  100%


Although the long-term timer is still LONG, and unless we get a complete collapse of the markets over the next week, it most likely will remain long through this bump.  If you are aggressive you can remain long with this latest signal to move to cash, but it could get painful.

Regards,

pgd

Sunday, April 1, 2012

Update for April 2nd

.
Since our allocation change on 3/14 we've been mostly horizontal in price movement:

G-Fund:  Up +0.043%  (@ 60% allocation)
F-Fund:  Up  +0.009% (@ 3% allocation)
C-Fund:  Up +0.115% (@ 15% allocation)
S-Fund:  Down -0.008% (@ 11% allocation)
I-Fund:  Up +0.008% (@ 11% allocation)

This is poor performance in the markets in general and is not indicative of the allocation amounts.  I generally think that the mix is correct -- bond yields (F-Fund) are on the rise, so we should see bond prices fall.  Rallies are typically led by small caps (S-Fund) so the fact that they are lagging here is indicative of a tired market, hence the lower allocation than the larger C-Fund (S&P500).  We need some international exposure (I-Fund) and in general, the I-Fund goes as the C-Fund and S-Fund, especially as of late, so I continue to keep my eye on this correlation.

Noting that we are at 40% exposure (60% in G-Fund, which is "cash"), I do not see any compelling reason to re-allocate at the present time.  Furthermore, in terms of local cycle, it is quite possible we could be heading downward, as this bull leg is getting quite tired, or alternatively, we could be heading higher through May.  As an example of thinking of this latter point, refer to this chart from Mike Turner, which was forwarded to me by one of our GGT members:


Of course, your crystal ball is as good as mine, and perhaps just as good as Mr. Turner's.  Caveat emptor.

Stay the course until it changes.

Regards,

pgd

Wednesday, March 14, 2012

Update for Wednesday, March 14th

With yesterday's action, all my models have signaled "buy" on the long side.

There is one crack in the ice though:

One indicator that I watch is indicating a possible short-covering rally, meaning that people were lulled into the "bear trap" last week, effectively shorting stocks. Now that the market has taken off, they are experiencing a great deal of pain and are having to "cover" their short positions.  This inflow of money is significant, as it drives demand up and with a constant supply, and it means that they are buying at higher prices.  When the shorts have covered (and it appears we are in day-three of this three-to-five day sequence), the bulls must step in and continue the run higher or we'll pull back again.  Given that this is options expiration week (OPX), rising volatility is expected and the chance of dropping is increased.

Given this situation, I am giving two scenarios:

1) Aggressive.

If your time horizon is longer you can afford to take more risk.  Your allocations are:

F-Fund:  8%
C-Fund:  38%
I-Fund:  28%
S-Fund: 26%

2) Conservative.

If your time horizons are shorter (~5-10 years), you should take less risk.  This is the model I follow for my wife's portfolio, which is up 3.65% over the past rolling 12 months:


F-Fund:  3%
C-Fund:  15%
I-Fund:  11%
S-Fund: 11%

G-Fund:  60%


I have made the changes to my wife's TSP account effective at the close of markets today.

Adjust the numbers to whatever level you are comfortable with, but I would keep the ratios.  Remember, you are responsible for your own decisions, and I am not.  Please take ownership for your actions.

Regards,

pgd

Friday, February 10, 2012

TSP Change Effective February 10th

A number of indicators I follow have moved to cash, so I’m moving some funds around within TSP.  Note that the long-term trend is up, as is the intermediate-term trend.

My contributions will remain on the long (invested) side, with the following allocations:

F-Fund:  +5%
C-Fund:  21%
I-Fund:  34%
S-Fund: 39%

My allocations will change to

G-Fund:  95%
F-Fund:  5%

I’m anticipating that we’ll be adjusting these again in the next week or two, but for now, I want to protect these gains.