Summary
- In intend to move 100% of my wife's funds to CASH, effective with the close today. New contribution allocations will be 100% into CASH.
===================
TSP Status
With the close of markets on 4/19/11, the GGT risk model has indicated that the C-Fund should be liquidated to cash. This is presently 98% of my holdings.
The natural question is now one of re-allocation between the remaining funds: F-Fund, I-Fund, and S-Fund. To answer this, it is important to understand where we are.
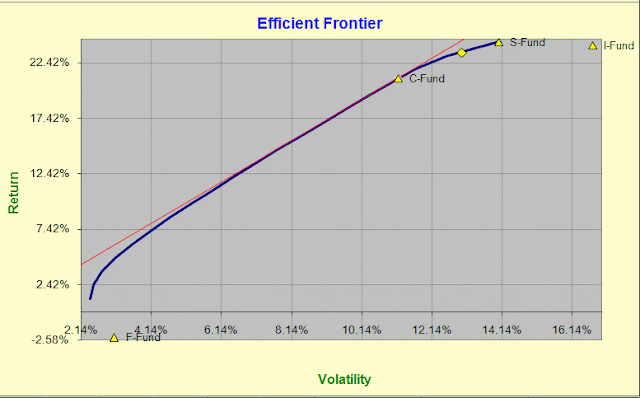
The graph above shows the return/volatility universe for the 3 equity funds available within TSP. Actual TSP data is used, e.g., proxy ETFs data was NOT used. The blue curve represents all the different combinations of C-Fund, S-Fund, and I-Fund that we can achieve within our portfolio. The unlabeled yellow diamond, located on the blue curve between C-Fund and S-Fund, is where we are today with our present portfolio. Note that the F-Fund is on the bottom of the figure, with an annualized return of less than 0%.
The analysis starts simply by asking the question "what combination moves us up greater than the return of where we are but does so at lower risk? We are already at 98% C-Fund, 1% in each of the S-Funds and I-Funds.
The math is complicated but there is no way to get greater projected return at lower risk than where we are today. This is because we are presently sitting on the blue curve -- we already have a portfolio that is extremely efficient.
The next part of the analysis looks at an adaptive moving average of each of the prices of the C-Fund, I-Fund, S-Fund, and F-Fund. When prices are below the moving average, we should sell. When prices are above the moving average, we should be long. It's a simple system and does not issue changes all that often (e.g., the C-Fund only offered 5 signals to move to CASH in the last 365 calendar days).
Right now the C-Fund has issued a signal to move to CASH, and this is confirmed for two consecutive days. The I-Fund and S-Fund are still long.
Strategy
The TSP funds offer the ability to exchange only 2x per month. This signal today will be 1 of those 2 exchanges.
I fully intend to move the C-Fund to cash. I will place the order at www.tsp.gov before noon EDT so that it is effective today.
The question now is what to do with the I-Fund and S-Fund allocations of 1% each.
In the risk-adjusted model, and with an eye towards the figure above, you can see that the I-Fund has greater volatility but has lower return over the past 100 days, when compared to the S-Fund. The calculations (not presented here) for allocation to the I-Fund ZERO any allocation in the I-Fund, as the volatility is increasing and return is decreasing. This is bad for our portfolio. This forces me to conclude that the money in the I-Fund will be moved to CASH.
This leaves 1% in the S-Fund. The risk-adjusted model actually indicates leaving this 1% intact, as a 100% allocation in the S-Fund falls directly on the blue-curve. 99% in cash simply lowers our risk of being in the S-Fund by .... wait for it ... 99%. Bottom line, if you want to leave some money in the S-Fund go ahead, but to align with the model, you probably should not have much in there at all (e.g., no more than 1%).
I personally intend to move 100% of everything to the G-Fund, which is CASH. No sense worrying about the 1%.
=================
Performance
The rolling, day-for-day 12-month realized performance of this strategy is 10.16%, as measured by www.tsp.gov. The drawdown, or the maximum value attained in equity to the lowest point since the peak is -1.1%. This gives me a reward/risk ratio of 9.24, and anything over 3.0 is considered outstanding. There is virtually no ulcer index with this strategy, which means I sleep well at night.
Since my last long signal on 3/28/11, I have realized the following performance with my stated allocations:
- close of 4/19/11: gain of +0.302%
- total trading days of signal: 17
- maximum equity peak during 3/28 - 4/19: +2.04% on 4/6
- maximum equity dip during 3/28 - 4/19: -0.269% on 4/18
- if 100% invested in G-Fund during same period: +0.183%
Overall, this isn't a great performance -- the risk-free approach is nearly the same as my achieved gain. I do note that in terms of daily change of the portfolio that we have the following averages over the last 17 trading days:
- G-Fund: +0.011%/day
- F-Fund: -0.052%/day
- C-Fund: +0.019%/day
- S-Fund: +0.041%/day
- I-Fund: +0.032%/day
- 98% C-Fund, 1% S-Fund, 1% I-Fund: 0.000%/day
I achieved virtually no volatility over the past 17 trading days, which is what I desire to do with this portfolio. This is what the Efficient Frontier methodology does for me. The cost is not participating in the highest gains at a disproportionate risk level, but I sleep well.
Markets will most likely be up today, so I will most likely finish well above the +0.302% level, handedly beating the risk-free return of the G-Fund. It doesn't always work out this way though.
==================
Remember, you are responsible for your own trading decisions, and I am not. Please do your diligence, and please take ownership for your actions.
Regards,
pgd

