With the close of markets on Friday, July 25th, my indicators are showing that a more conservative stance should be taken, at least on a short-term basis.
Here are the new allocations:
G-Fund: 25%
C-Fund: 41%
I-Fund: 22%
S-Fund: 12%
The rationale around this shift has many components, but suffice to say that we're seeing a lack of participation of small cap stocks (S-Fund) and a larger push towards the larger caps (C-Fund).
Since the last allocation change (effective June 30) we've remained relatively flat on performance:
C-Fund, 39% allocation, up +0.40%
I-Fund: 9% allocation, down -0.05%
S-Fund: 52% allocation, down -1.15%
The net of these allocations and performance is a loss of -0.79% in the account.
For the same period the S&P500 was up +1.17%. Of course, hindsight being what it is, it would have been better being 100% in the C-Fund (C-Fund change +1.03%) but my crystal ball is as good as yours.
To show that I eat what I kill, here are the upcoming allocations:

12 month rolling performance is as follows with less than 1% loss in the account. I've taken a bit more risk in the last several months as I've refined the methods, so I expect gains/losses will increase but the overall risk will remain fairly constant:

~~~~~~~~~~~~~~~
I recently received an email asking how I derive these numbers. The process is relatively straight forward -- I attempt to maximize forward looking gains against minimizing volatility. This all has to be done in context of what "the market" is doing now, and as we all know, this is a moving target.
When people say "the market" the little voice in my head asks "which one?". I say this because different areas of the market act differently at different times. I measure this using something called correlation -- and the result is a matrix as shown below:

Here, ^GSPC is the Yahoo! symbol for the S&P500, and VXF is the Vanguard Extended Market fund, which is an exchange traded fund, much like a mutual fund. The C-Fund and ^GSPC (S&P500) have a "perfect" correlation -- they move together, and the S-Fund and VXF also have a perfect correlation.
In context of "the markets", the real question is what are the expectations of performance given present allocations? Again, remember that performance has to be measured relative to "something".
Let's start with the VXF as the benchmark:
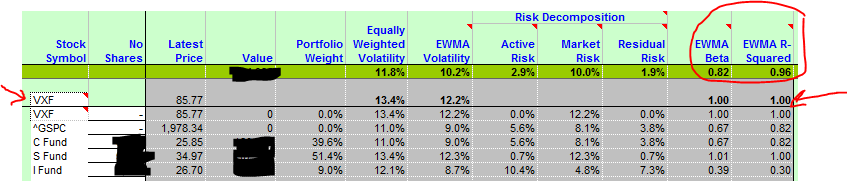
I've circled an area that states "beta" and "R-squared". Beta is the market reference; in this case the VXF is assigned a value of 1.00 and a perfect R-Squared (correlation) of 1.00. For the portfolio allocations over the past month (since June 30th) the expectation was that, relative to the VXF that the portfolio would perform at 82% of the VXF performance, and that 96% of the portfolio performance could be explained by the VXF movement. As it turned out, the VXF fell -1.36% over the last month (not shown but available here) and the portfolio actually only fell -0.79%, so we outperformed the market, relative to the VXF.
What about the "other market", the S&P500? Same process:

Here, ^GSPC is the Yahoo! symbol for the S&P500 market index. Note that the portfolio allocations over the past month are "hotter" than simply investing in the C-Fund (S&P500) -- the beta of 1.09 indicates that the portfolio has the potential to outperform the S&P500 by about 9% of the S&P500 change. This is due to the potential of the VXF (S-Fund) allocation - VXF has (typically) greater performance, but greater volatility too. Adding VXF (S-Fund) adds potential upside/downside, but it also adds risk (volatility).
Te S&P500 went up +1.08% over the last month but the total TSP account fell -0.79% In hindsight this is a "miss", but remember, this is using today's numbers and applying them backwards. What if we used the values available only up to June 27th, which is when I last ran the allocation estimates?
The surprising answer is that the beta estimates and R-Squared values are almost unchanged (less than 1% change). So, sitting back on June 27th, I was looking at 1) how to outperform the S&P500 performance with a high confidence level (expected 9% outperformance of the S&P500 at better than 93% correlation) while minimizing exposure to higher volatility (typically S-Fund, projected allocations said that I would vary at 82% of the S-Fund/VXF variance with a 96% confidence). The higher performance expectation was derived from the overweighting in S-Fund holdings and by adding C- and I-Fund components I was able to minimize portfolio volatility, lowering overall risk.
From a June 27th perspective I *could* have simply put it all in C-Fund and could have been up +1.03% for the period. C-Fund had been underperforming the S-Fund up to this period so that didn't make sense. On the other hand, the S-Fund had been on fire, so overweighting the S-Fund to 100% would have resulted in a loss of -1.36%, so that would have been a terrible miss. Remember, my crystal ball is as good as yours.
It's all a balancing act -- I'm getting better at it, but it's a moving target.
~~~~~~~~~~~~~~~
Remember, you are responsible for your own investment decisions and I am not. Please do your own diligence, and please take ownership for your actions.
My allocation changes will be effective with the close of markets on July 28th.
Regards.