I'm sure many of you are wondering if the TSP allocations are going to flip any time soon, as the markets are up substantially in the last week or so.
Before we get there, let's review a couple of key points:
1) we can only move 2x within a given month.
2) historically, summer rallies are suspect, and are quite often fickle, as they can change quickly. This can quickly unravel any unrealized gains that we have attained.
With this backdrop, let's look at the relevant timers:
Right click on the image to open in a separate window or browser tab.
This first one is the GGT set of timers that I use on proxy ETFs. Here:
AGG = F-Fund
EFA = I-Fund
SPY = C-Fund
VXF = S-Fund
This set of timers uses price and volume to move long, and only price to move to cash.
You can see that the recommendations of the GGT system point us towards:
AGG / F-Fund in CASH
EFA / I-Fund invested LONG
SPY / C-Fund in CASH
VXF / S-Fund invested LONG
Quite a mixed bag. What is best is when these are confirming, e.g., AGG is CASH (as now) and the others are all LONG (SPY is the holdout). We do NOT have confirmation of this bull leg according to this timing system.
=============
We can group the three equity trades into a basket to form an index. When the 5d simple moving average crosses the 65d SMA from below, we have a general buy signal for the three equities. When the 5d crosses the SMA from above, we have a general sell signal.
This method is confirmed by the slope of the 65d SMA -- when it is positive, we have confirmation. When it is negative, we avoid long positions.
This method avoids volume considerations.
Here's the chart:

The top pane is the slope of the 65d simple moving average. You can see that it is positive, which is bullish. You can also see that it is trending SIDEWAYS, e.g., not moving up. This is cautionary.
You can see in the next lower pane that the 5d crossed the 65d from below. In general this is a good indication, and is confirmed with the slope of the 65d above.
Finally, we see that in the pricing pane that price has started to trade above the 65d MA. While not on a upward trajectory, the repeated close above the 65d for the past 4 days is encouraging.
From this chart, we can conclude that we have a confirmed entry on the 3 equity positions: I-Fund, S-Fund, and C-Fund.
====================
Before we get all excited, I think it's important to understand the money flow into each of these ETFs. Note that this is for the ETFs, NOT the individual funds (C-Fund, I-Fund, F-Fund, S-Fund). The importance here is that the market plays these ETFs just like we are playing the TSP funds, so it's a reasonable proxy to be able to look at each of these ETFs in terms of money flow.
You can do this work yourself by joining the Effective Volume group at http://forums.effectivevolume.com
Here's AGG / F-Fund:
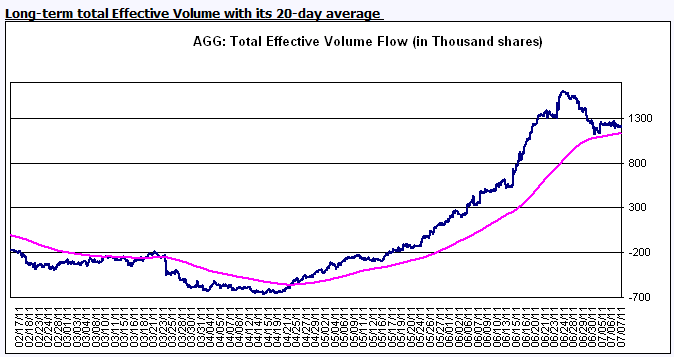
You're looking at what the large players are doing with AGG, which is a bond fund. The blue trace is total effective volume (TEV), and the purple trace is a 20d moving average.
I look for the 20d MA to be pointing upward for a confirmation that I should be in the equity. As you can see, AGG is still attracting money, but is doing it less fast than a few weeks ago. If the TEV line crosses below the 20d MA then institutional support for AGG is declining, which is a bigger problem. In general, I would not abandon AGG / F-Fund, simply because the 20d TEV line is still pointing upwards.
Next is the EFA / I-Fund:

Here, you can see that the 20d TEV line is in a strong uptrend, and that daily TEV continues to pull this line upward rather aggressively. EFA / I-Fund appears to have significant institutional support, although you can see that over the past few months it has been very, very choppy. This is somewhat problematic for our time horizon, but nevertheless, right now EFA appears to have the required sponsorship.
Next is the SPY / C-Fund:

The SPY is one of the most liquid (traded) ETFs on the market, so the TEV values above are quite relevant. You can see that the 20d TEV levels are in a significant uptrend, and appears very strong. Institutional support for the SPY is very strong.
Finally, the VXF / S-Fund is the last ETF to consider:

The presentation changed because the Effective Volume site does not track VXF, which is not nearly as liquid as the other ETFs.
The yellow and blue traces above are the relevant TEV and Large EV traces for VXF respectively, over the past week or so. The nearly-horizontal red trace shows that Small EV folks (you and I) are not moving aggressively into VXF as an instrument. The positive divergence of the TEV for VXF does point to significant institutional support, so I am encouraged.
Conclusion: EFA has choppy TEV patterns, which means institutional support is mixed and fickle. AGG, SPY, and VXF all look relatively good in terms of institutional support.
=====================
Given these conditions, the last decision is whether to jump in today, Friday, or wait for a pullback.
I prefer to wait for a pullback. As long as the TEV 20d lines remain in an uptrend, we're relatively safe. As long as the TEV continues to trade above the 20d lines, we have institutional support. The overall problem is that the markets are heavily overbought, and there has not been a good opportunity to get into this rally except just to plunge in. I do not "plunge", so I'm going to wait for the inevitable pullback.
For those of you who are aggressive, you can go with the following allocations:
AGG / F-Fund: 6%
EFA / I-Fund: 10%
SPY / C-Fund: 38%
VXF / S-Fund: 46%
This allocation will take advantage of the recent momentum but understand, it is a very aggressive stance.
=========================
The maximum gain/minimum volatility play is 100% in the VXF / S-Fund. It is not unreasonable to expect an incredible amount of volatility here (~ 17%), but of the 4 funds, this has the largest potential gains going forward.
========================
The minimum volatility play, if you are not convinced in this market action, is as follows:
AGG / F-Fund: 87%
EFA / I-Fund: 2%
SPY / C-Fund: 10%
VXF / S-Fund: 1%
If we see a pullback I expect that AGG will perform quite well, relative to the other securities. Conversely, if we continue upwards, this portfolio mix will significantly underperform the markets.
=====================
Uncertain times. You'll have to choose the portfolio mixture that is aligned with your tolerance for drawdown and volatility.
I personally am going to wait for a pullback in the markets before changing my allocation, which is heavily weighted in the F-Fund.
====================