.
With the close of markets on Wednesday, October 10th, my TSP models have confirmed a 100% move to cash.
I will transfer 100% of my holdings to the G-Fund, effective with the close today.
Regards,
pgd
Thursday, October 11, 2012

Friday, September 14, 2012
Pending Travel and Implications
.
All,
I am going to be unavailable to evaluate signals from Thursday, September 20th through Wednesday, October 4th, as I will not have access to the internet for nightly downloads. This means that I will not be able to notify you if we get a sell signal until after my return.
This obviously leaves a few options for me:
1) Do nothing with my wife's TSP portfolio.
This is probably not a bad approach -- I anticipate that although the road ahead will be rocky between now and The Election, the overall trend is most likely upwards. My time horizon is still far off before we can tap these monies, so we have lots of time to make up losses if they occur while I'm gone. This is my preferred approach going into the weekend.
2) Move the TSP portfolio 100% into the G-Fund (cash), and do the same with future contributions.
This is the safest approach, but not necessarily the most prudent. The issue here is that as the market climbs higher, we'll miss any chance of appreciation since the interest rate on the G-Fund is practically 0%. The positive with this approach is that there is virtually no chance of losing ground, and the gains since 9/5 (about 4-5%) will be locked in. I certainly can add back to the account once I return.
3) Move the TSP portfolio holdings to 100% G-Fund, but keep future contributions working.
This isn't a bad approach overall. This ensures that the gains to date are locked in and if the markets continue higher, any new money will move higher with it. The downside is that if the markets move higher the amount of gains lost will dwarf anything gained by future contributions (because the base value of the account is considerably higher than the individual contribution). The upside to this approach is the same as 2) in that gains to date are protected.
4) Move a % to cash and leave the rest to work.
I think that this is the most prudent choice if I don't do 1). It protects some of the gains to date and limits the losses on the downside.
Please evaluate your personal situation and make your choice as it best suits you.
Regards,
pgd
All,
I am going to be unavailable to evaluate signals from Thursday, September 20th through Wednesday, October 4th, as I will not have access to the internet for nightly downloads. This means that I will not be able to notify you if we get a sell signal until after my return.
This obviously leaves a few options for me:
1) Do nothing with my wife's TSP portfolio.
This is probably not a bad approach -- I anticipate that although the road ahead will be rocky between now and The Election, the overall trend is most likely upwards. My time horizon is still far off before we can tap these monies, so we have lots of time to make up losses if they occur while I'm gone. This is my preferred approach going into the weekend.
2) Move the TSP portfolio 100% into the G-Fund (cash), and do the same with future contributions.
This is the safest approach, but not necessarily the most prudent. The issue here is that as the market climbs higher, we'll miss any chance of appreciation since the interest rate on the G-Fund is practically 0%. The positive with this approach is that there is virtually no chance of losing ground, and the gains since 9/5 (about 4-5%) will be locked in. I certainly can add back to the account once I return.
3) Move the TSP portfolio holdings to 100% G-Fund, but keep future contributions working.
This isn't a bad approach overall. This ensures that the gains to date are locked in and if the markets continue higher, any new money will move higher with it. The downside is that if the markets move higher the amount of gains lost will dwarf anything gained by future contributions (because the base value of the account is considerably higher than the individual contribution). The upside to this approach is the same as 2) in that gains to date are protected.
4) Move a % to cash and leave the rest to work.
I think that this is the most prudent choice if I don't do 1). It protects some of the gains to date and limits the losses on the downside.
Please evaluate your personal situation and make your choice as it best suits you.
Regards,
pgd
Wednesday, September 5, 2012
Reaffirming Long Entry for Sept 5th
With the close of markets on September 4th, my models have indicated that I should move long into the three equity funds (C-Fund, I-Fund, S-Fund).
My allocations are as follows:
C-Fund: 23%
I-Fund: 14%
S-Fund: 63%
If I make the exchange prior to noon on 9/5 the transaction will complete with the end-of-day prices on 9/5.
I have already made the transfer request.
As with all of my postings, you are responsible for conducting your own diligence. Please take personal ownership for your investment actions.
Regards,
pgd
My allocations are as follows:
C-Fund: 23%
I-Fund: 14%
S-Fund: 63%
If I make the exchange prior to noon on 9/5 the transaction will complete with the end-of-day prices on 9/5.
I have already made the transfer request.
As with all of my postings, you are responsible for conducting your own diligence. Please take personal ownership for your investment actions.
Regards,
pgd
Monday, July 16, 2012
Whipsaw Signal -- Moving Back to G-Fund
.
With the close of markets on Friday, July 13th, the TSP models are signaling a move to G-Fund. This is a short-term whipsaw and is due to the failed breakout of the C-, S-, and I-Funds from the previous signal. Volatility is on the rise, but prices are not, and this divergence has historically not been favorable over the long term.
Effective immediately, I am transitioning back to 100% G-Fund and due to the 2x / month change rule, will be here for the remainder of the month. If today is not too bad in terms of close we may exit this trade near -0.6% for C-Fund, +1.2% for S-Fund, and -1.5% for I-Fund.
Cash (G-Fund) is king.
Regards,
Paul
With the close of markets on Friday, July 13th, the TSP models are signaling a move to G-Fund. This is a short-term whipsaw and is due to the failed breakout of the C-, S-, and I-Funds from the previous signal. Volatility is on the rise, but prices are not, and this divergence has historically not been favorable over the long term.
Effective immediately, I am transitioning back to 100% G-Fund and due to the 2x / month change rule, will be here for the remainder of the month. If today is not too bad in terms of close we may exit this trade near -0.6% for C-Fund, +1.2% for S-Fund, and -1.5% for I-Fund.
Cash (G-Fund) is king.
Regards,
Paul
Friday, July 6, 2012
Unconfirmed Signal Change Effective 7/6/12
.
With the close of markets on 7/5/12, we have an unconfirmed signal change for the Thrift Savings Plan allocations. "Unconfirmed" means that the long-term timer is not yet confirming this move, but short-term and intermediate-term timers have now indicated we should be back in the market.
Correspondingly, holding 50% in cash could be prudent, as we could fail this signal. Summer is typically not a strong period to initiate new long-term trends, so I am not overly optimistic. Your crystal ball is as good as mine though, and I am compelled to follow my rules.
Aggressive:
C-Fund: 32%
I-Fund: 30%
S-Fund: 38%
G-Fund: 0%
F-Fund: 0%
Conservative:
C-Fund: 16%
I-Fund: 15%
S-Fund: 19%
G-Fund: 49%
F-Fund: 1%
If you make the change before 12:00 EDT the funds will be transferred this evening.
Again, remember that this is not a recommendation to buy/hold/sell. This model is presented for your education and consideration. You are responsible for your own actions. Please do your own diligence in making any decisions.
Regards,
pgd
With the close of markets on 7/5/12, we have an unconfirmed signal change for the Thrift Savings Plan allocations. "Unconfirmed" means that the long-term timer is not yet confirming this move, but short-term and intermediate-term timers have now indicated we should be back in the market.
Correspondingly, holding 50% in cash could be prudent, as we could fail this signal. Summer is typically not a strong period to initiate new long-term trends, so I am not overly optimistic. Your crystal ball is as good as mine though, and I am compelled to follow my rules.
Aggressive:
C-Fund: 32%
I-Fund: 30%
S-Fund: 38%
G-Fund: 0%
F-Fund: 0%
Conservative:
C-Fund: 16%
I-Fund: 15%
S-Fund: 19%
G-Fund: 49%
F-Fund: 1%
If you make the change before 12:00 EDT the funds will be transferred this evening.
Again, remember that this is not a recommendation to buy/hold/sell. This model is presented for your education and consideration. You are responsible for your own actions. Please do your own diligence in making any decisions.
Regards,
pgd
Saturday, May 5, 2012
Update for Monday, May 7th -- Move to G-Fund
This has not been a productive investment cycle, but that obviously is done with hindsight. We never know where the next signal is coming from, so remember that we are compelled to follow the model as long as it performs well over the long haul.
With the close of markets on Friday, May 4th, the GGT/TSP model has signaled that we should close all positions and move to a combination of G-Fund and F-Fund. I simply think bond-risk isn't worth the trouble, so I'm moving everything to G-Fund for now.
As with all my images, right-click on the picture to open in a new tab or window.
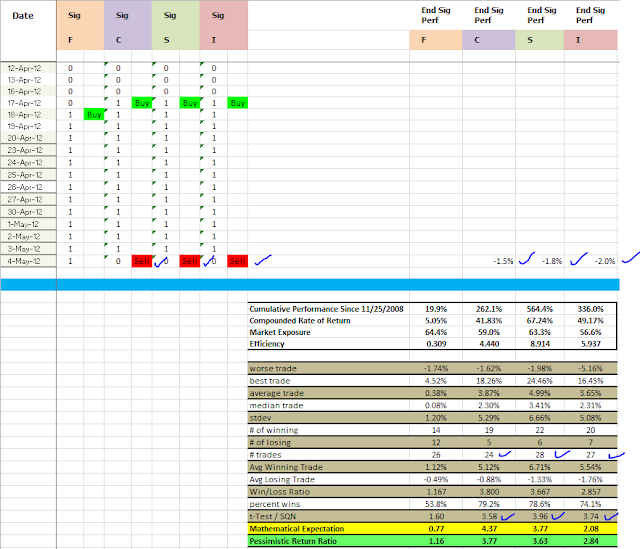
As you can see in the upper right area, this last sequence since the last buy signal has not been positive. The actual amount lost will be a function of Monday's behavior -- if it's up the losses will be slightly less than shown, if Monday's markets are down we will record a greater loss.
The table shows that over the long haul, e.g., since 11/25/08, the model has been quite productive and accurate. This is my "new" model which I recently improved (substantially) from the previous one which missed the December/January signals. This model also has a different set of metrics which are independent, so I can watch behavior on multiple inputs and ensure that we're behaving the way we expect to. To date I have not been able to develop an independent model which outperforms the statistics above.
The F-Fund, which is a bond fund, has the "worse" performance overall and is shown on the left of the table stats. The model's signalling engine is based in stocks, not in bonds, and it goes to reason that timing bonds with stocks is probably not a good thing in the long haul. Before we discount the F-Fund all together, note that overall, it does perform "okay" for a bond (low-volatility, low risk) vehicle, so it can play a role in our strategy if we decide it should. Note that I personally do not use the F-Fund in my allocations, as I am an aggressive investor.
The C-, S-, and I-Fund statistics are all quite compelling. The Compounded Rates of Return (CRR) for the three range from 41% to 67% over the past 3.5 years. The model has us invested between 56% and 63% of the time to produce those returns, so you can see that it is quite efficient (keep our powder dry when the model says to stay away).
Although equity and gains are what we bank and what we retire on, equity/gains are not the entire picture. The 3 metrics at the bottom: t-Test/SQN, Mathematical Expectation (ME), and Pessimistic Return Ratio (PRR) are all methods to quantify the robustness of the model, and they specifically check to ensure that the model does not lock in big losses relative to the wins it captures, and it rewards a greater number of trades, such that the more consistent the trades over time, the better the metrics.
t-Test/SQN is a methodology developed by Van K. Thorp and basically tests whether we are outperforming the null hypothesis, e.g. are we better than chance. From an empirical viewpoint, we want this value to be above 1.7 with the number of trades well above 20-30, but with a model such as ours (restricted to 2 trades / month), it will take some time to develop numbers way above 20-30. As you can see the number of trades in the C-, S-, and I-Funds are in the 24 - 28 range, which is just becoming statistically significant.
Mathematical Expectation is the "edge" of the system. In Vegas, the edge for the House is generally positive with all games except video poker, which is a loss-leader to get you deeper into the casino. This means that when you throw lots of people with money at their games, they will win in the long haul. ME values need to be positive for any system over the long haul, and values above 0.5 or so are good systems. Dr. Diliddo of VectorVest fame regularly produces ME values in the 0.3 - 0.8 range on portfolios that return a positive CRR over a year, so we don't need values as high as shown. I've rechecked the math and the values shown are not in error -- the TSP model produces very good results consistently, and consistency is rewarded in higher ME values.
Pessimistic Return Ratio (PRR) is also the "edge" of the system, but calculated very differently than T-Test or ME. If we had an infinite number of trades (we won't live long enough), the PRR will converge on a number called the Profit Factor, which you will find in many brokerage reports on your trading performance. Profit factor completely falls apart if the number of trades is low, hence, PRR is better because it considers the number of trades in the system AND it weights wins/losses accordingly. We want values above 1.0 here and values above 2.0 - 2.5 are considered good systems. We want the number of trades to be larger than 24 when looking at PRR, and you can see that we just hit that threshold with the C-Fund.
In the end, I'm moving my funds to cash, effective with the close of markets on Monday, May 7th.
Regards,
pgd
With the close of markets on Friday, May 4th, the GGT/TSP model has signaled that we should close all positions and move to a combination of G-Fund and F-Fund. I simply think bond-risk isn't worth the trouble, so I'm moving everything to G-Fund for now.
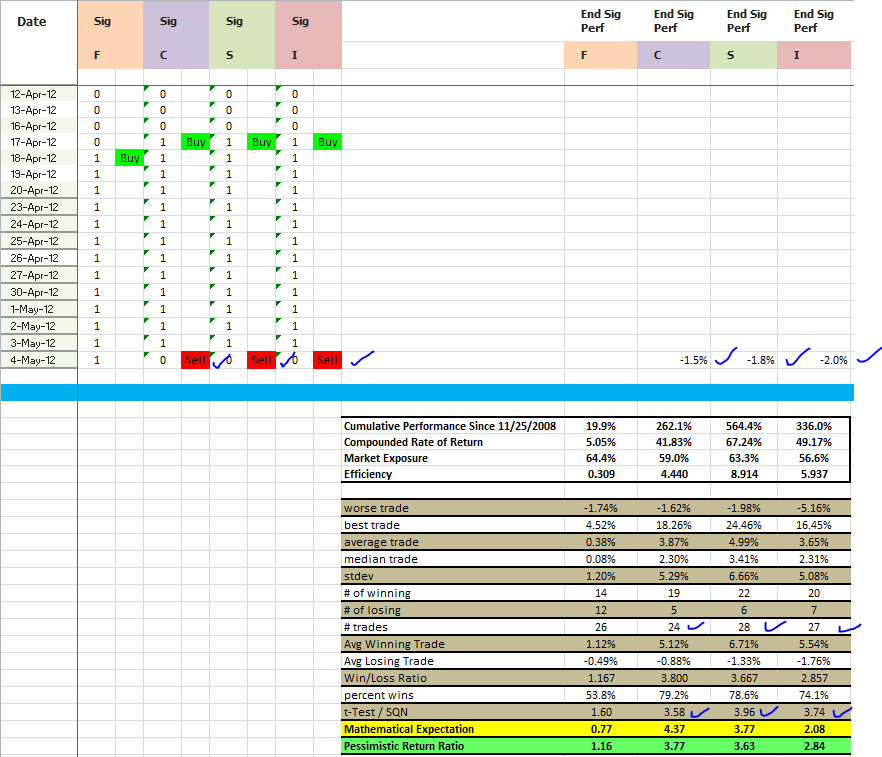
As you can see in the upper right area, this last sequence since the last buy signal has not been positive. The actual amount lost will be a function of Monday's behavior -- if it's up the losses will be slightly less than shown, if Monday's markets are down we will record a greater loss.
The table shows that over the long haul, e.g., since 11/25/08, the model has been quite productive and accurate. This is my "new" model which I recently improved (substantially) from the previous one which missed the December/January signals. This model also has a different set of metrics which are independent, so I can watch behavior on multiple inputs and ensure that we're behaving the way we expect to. To date I have not been able to develop an independent model which outperforms the statistics above.
The F-Fund, which is a bond fund, has the "worse" performance overall and is shown on the left of the table stats. The model's signalling engine is based in stocks, not in bonds, and it goes to reason that timing bonds with stocks is probably not a good thing in the long haul. Before we discount the F-Fund all together, note that overall, it does perform "okay" for a bond (low-volatility, low risk) vehicle, so it can play a role in our strategy if we decide it should. Note that I personally do not use the F-Fund in my allocations, as I am an aggressive investor.
The C-, S-, and I-Fund statistics are all quite compelling. The Compounded Rates of Return (CRR) for the three range from 41% to 67% over the past 3.5 years. The model has us invested between 56% and 63% of the time to produce those returns, so you can see that it is quite efficient (keep our powder dry when the model says to stay away).
Although equity and gains are what we bank and what we retire on, equity/gains are not the entire picture. The 3 metrics at the bottom: t-Test/SQN, Mathematical Expectation (ME), and Pessimistic Return Ratio (PRR) are all methods to quantify the robustness of the model, and they specifically check to ensure that the model does not lock in big losses relative to the wins it captures, and it rewards a greater number of trades, such that the more consistent the trades over time, the better the metrics.
t-Test/SQN is a methodology developed by Van K. Thorp and basically tests whether we are outperforming the null hypothesis, e.g. are we better than chance. From an empirical viewpoint, we want this value to be above 1.7 with the number of trades well above 20-30, but with a model such as ours (restricted to 2 trades / month), it will take some time to develop numbers way above 20-30. As you can see the number of trades in the C-, S-, and I-Funds are in the 24 - 28 range, which is just becoming statistically significant.
Mathematical Expectation is the "edge" of the system. In Vegas, the edge for the House is generally positive with all games except video poker, which is a loss-leader to get you deeper into the casino. This means that when you throw lots of people with money at their games, they will win in the long haul. ME values need to be positive for any system over the long haul, and values above 0.5 or so are good systems. Dr. Diliddo of VectorVest fame regularly produces ME values in the 0.3 - 0.8 range on portfolios that return a positive CRR over a year, so we don't need values as high as shown. I've rechecked the math and the values shown are not in error -- the TSP model produces very good results consistently, and consistency is rewarded in higher ME values.
Pessimistic Return Ratio (PRR) is also the "edge" of the system, but calculated very differently than T-Test or ME. If we had an infinite number of trades (we won't live long enough), the PRR will converge on a number called the Profit Factor, which you will find in many brokerage reports on your trading performance. Profit factor completely falls apart if the number of trades is low, hence, PRR is better because it considers the number of trades in the system AND it weights wins/losses accordingly. We want values above 1.0 here and values above 2.0 - 2.5 are considered good systems. We want the number of trades to be larger than 24 when looking at PRR, and you can see that we just hit that threshold with the C-Fund.
In the end, I'm moving my funds to cash, effective with the close of markets on Monday, May 7th.
Regards,
pgd
Thursday, April 26, 2012
Signal change for Thursday, April 26th
.
With the close of markets on Wednesday, April 25th, my TSP models have signaled a transition from cash to invested.
NOTE: This is not investment advice. You are responsible for your own actions and I am not. Please do your own diligence and please take ownership for your actions.
In the conservative portfolio, the model is suggesting the following allocations:
F-Fund: 38%
C-Fund: 30%
I-Fund: 10%
S-Fund: 22%
Substituting the G-Fund for the F-Fund is also a safe and prudent action.
In the ggressive portfolio (longer than 10 years before needing the monies), the model is suggesting the following:
C-Fund: 49%
I-Fund: 17%
S-Fund: 34%
Changes made before noon will be effective at the close.
I intend to transition to fully invested using the aggressive portfolio.
For you folks who like statistics, I've updated the model to be consistent with my other models and have the following table:

The four TSP funds are listed across the top. This is a table which uses the actual closing prices of the TSP funds, and the model accounts for transfers that are made the following night AFTER a signal.
Of importance is simply that we have a "good" number of trades in each fund and the statistics get us in the ball park.
In general, the I-Fund, which is an international fund, has experienced the worse loosing trade. Note that the average losing trade is the worse with this model. Certainly not bad, but simply the more volatile of all the other funds.
The F-Fund is the weakest performer, not in terms of equity, but in terms of metrics. The t-test/SQN value of 1.60 is below minimum of 1.7 and suggests that the model is not in sync for the bond fund. This is probably true, because the underlying engine is equity-based, not bonds. Timing bonds with equity movements doesn't always work out in our favor. Hence, a strategy here is to presently substitute the G-Fund for F-Fund and remove all bond risk.
Regards,
pgd
With the close of markets on Wednesday, April 25th, my TSP models have signaled a transition from cash to invested.
NOTE: This is not investment advice. You are responsible for your own actions and I am not. Please do your own diligence and please take ownership for your actions.
In the conservative portfolio, the model is suggesting the following allocations:
F-Fund: 38%
C-Fund: 30%
I-Fund: 10%
S-Fund: 22%
Substituting the G-Fund for the F-Fund is also a safe and prudent action.
In the ggressive portfolio (longer than 10 years before needing the monies), the model is suggesting the following:
C-Fund: 49%
I-Fund: 17%
S-Fund: 34%
Changes made before noon will be effective at the close.
I intend to transition to fully invested using the aggressive portfolio.
For you folks who like statistics, I've updated the model to be consistent with my other models and have the following table:
The four TSP funds are listed across the top. This is a table which uses the actual closing prices of the TSP funds, and the model accounts for transfers that are made the following night AFTER a signal.
Of importance is simply that we have a "good" number of trades in each fund and the statistics get us in the ball park.
In general, the I-Fund, which is an international fund, has experienced the worse loosing trade. Note that the average losing trade is the worse with this model. Certainly not bad, but simply the more volatile of all the other funds.
The F-Fund is the weakest performer, not in terms of equity, but in terms of metrics. The t-test/SQN value of 1.60 is below minimum of 1.7 and suggests that the model is not in sync for the bond fund. This is probably true, because the underlying engine is equity-based, not bonds. Timing bonds with equity movements doesn't always work out in our favor. Hence, a strategy here is to presently substitute the G-Fund for F-Fund and remove all bond risk.
Regards,
pgd
Subscribe to:
Posts (Atom)