Thursday, August 14, 2014

Signal Change with 8/13 Close

.
Pushed for time today so this will be brief.

With the close of markets on Wednesday, 8/13, the TSP allocation has signaled a change to LONG.

The signals are weak and mixed, but they are over the threshold and hence, I'm compelled to move long.

Here are the allocations:

Conservative
AGG F-Fund 38%
SPY C-Fund 27%
EFA I-Fund 11%
VXF S-Fund 24%
100%
Aggressive
SPY C-Fund 44%
EFA I-Fund 18%
VXF S-Fund 38%
100%

My horizon in long-term (greater than 10 years) so I am aligning myself with the Aggressive portfolio.  Changes made in my TSP account by 12:00 ET will be effective tonight.

~~~~~~~~~~~~~~~~

Obviously, do your own diligence.  You are responsible for your investment decisions and I am not.  Please take ownership for your actions.

Regards,

pgd 

Wednesday, August 6, 2014

8/5/2014 Signals Transition to Cash

.
I'm on the road this week so keeping up on the market has not been as easy as you may think.

With the close of markets over the past few days, and confirmed on 8/5, my indicators are showing that it's time to move to cash and wait for the storm clouds to pass.  There are a number of indicators that are bearish, and getting all of these to "line up" is relatively rare except at market transitions.

Of course, your crystal ball is as good as mine.

Since ALL my fail-safe indicators are now bearish, my trading plan has me moving to 100% cash.  I have no choice in the matter, as the system has worked for years to keep me out of trouble, especially in the 2008-2009 time frame.

BUT, if you are inclined to consider that we dropped very quickly and are technically oversold and could have a bounce here, a possible good allocation is as follows:

CASH (G-Fund):  53%
S&P500 (C-Fund):  28%
International (I-Fund): 8%
Small-Cap (S-Fund):  11%

I personally am not following these allocations and I will not be tracking the performance of this mixture going forward.  I also will not use these numbers to influence future allocations.

Although I have numbers for a non-cash stance I'm not going to provide them -- I think they are too aggressive and simply do not consider that we're in a downward momentum phase of the markets.

~~~~~~~~~~~~

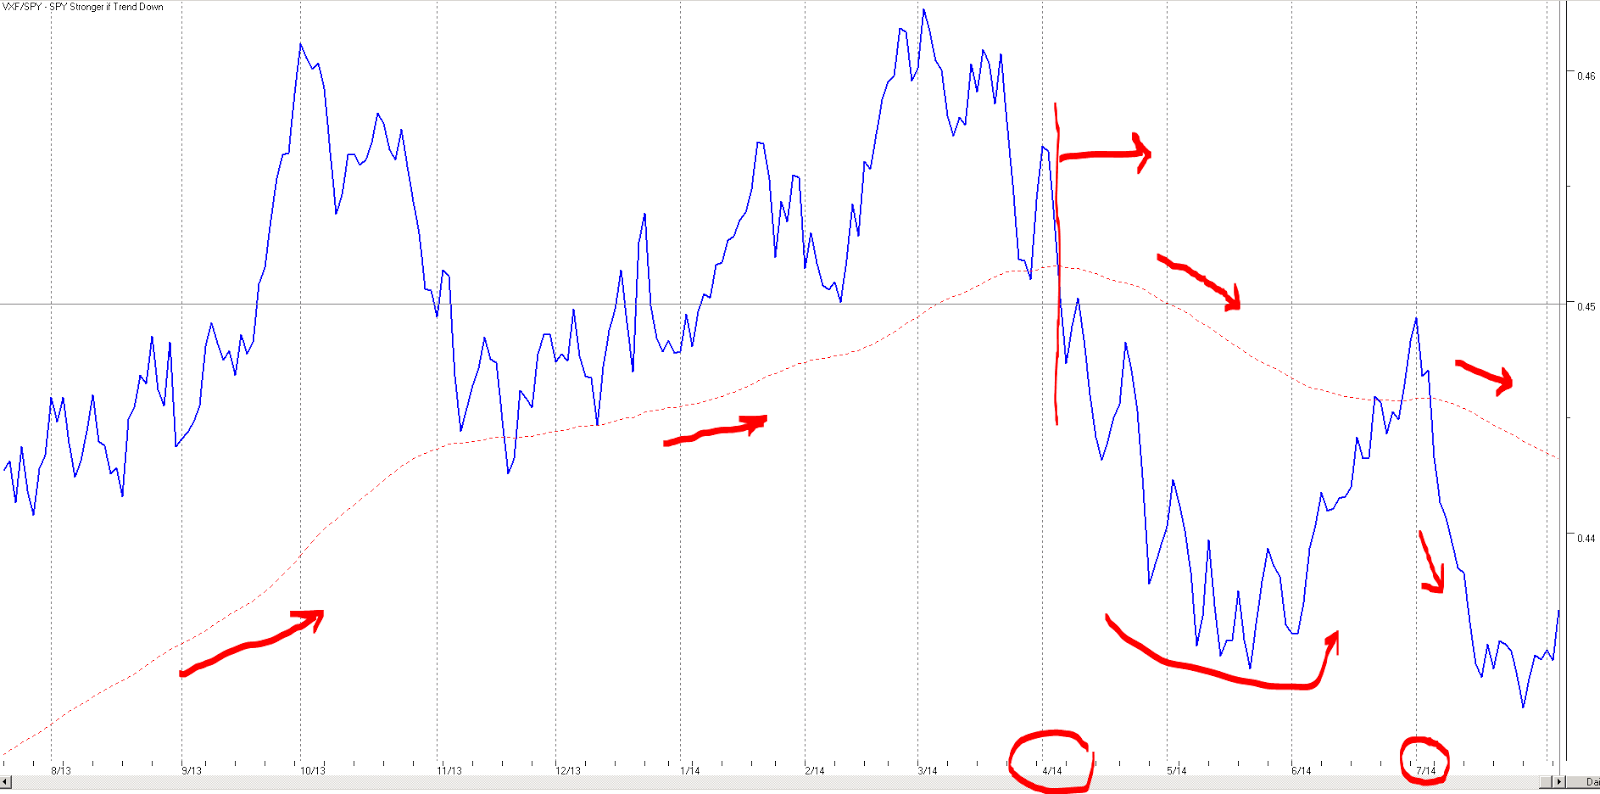
There is no doubt in my mind that we're seeing a transition to safety on a longer-term basis, and this means that we're entering a new phase of the market.  This is best illustrated by a relationship that I follow which is the VXF ETF (which represents all the stocks in the market except those in the S&P500) and the SPY (which is the S&P 500 SPDR).  Typically, the VXF is considered a "small cap" fund, where the SPY is considered large caps.  Indeed, if you look at the individual holdings of each of these ETFs and sort by market cap you can see that the SPY dominates VXF in overall total market cap.

Here's the graph:


Right-click on the image to open in a new tab or window.

The first thing to realize is that up until around the middle of April, the longer-term trend line showed that VXF was outperforming the SPY.  There were short-term violations of this concept, but the trend remained intact until mid April.  As you can see in the graph above, the trend line has now taken on a downward slope, which means that the SPY is outperforming the VXF on a 65d time frame.  There will be short-term violations of this statement too, but in general, money is moving to safety.

The implication for the TSP funds is that going forward we want more allocation to the C-Fund and away from the S-Fund, at least on a medium to long-term basis.

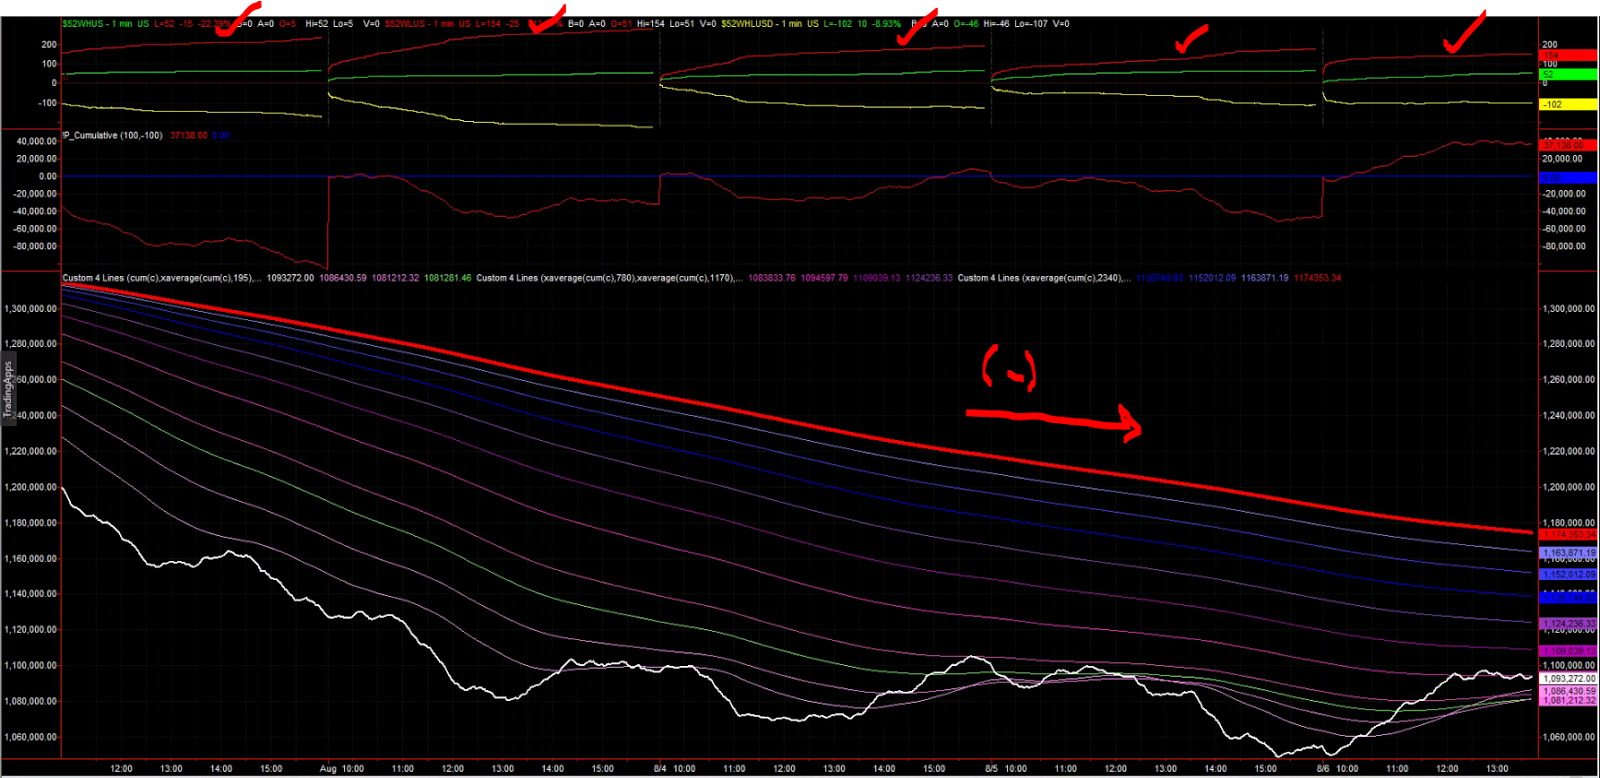
The next indicator that I use, which has not been in this territory for some time, is called a Cumulative Tick Ribbon.  Essentially, this is a cumulative count of minute-by-minute transactions on the major exchanges, and it tallies whether all the stocks for a specific "tick" are increasing in price or decreasing in price.  When you average these over multiple time frames you get an interesting view:


Right-click on the image to open in a new tab or window.

Ignore the top two panels and simply look at the bottom panel.

The white trace is the real-time, non-averaged value.  The red trace is the longest time frame that I average, about 10 trading days.  The negative slope of this line is troubling -- it simply tells me that on this time frame that we're down significantly.  Further, since the slope is relatively constant for all the days shown, it tells you that we're not out of the woods yet.

Your eye may catch that the real-time, non-averaged value appears to have stabilized into a range.  Yes, this is indeed what we are seeing, so perhaps we're at a bottom.  We could also be at a pause with a potential to continue downward -- I simply do not know.  Best to be prudent and protect gains.

The top panel in the figure above shows the number of NEW LOWS (red), NEW HIGHS (green), and difference between the two (yellow).  This is over the past 52 weeks.  The figure shows, without any ambiguity, that we are solidly hitting NEW LOWS on a day-over-day basis.  Until that green line starts dominating the red line, I'll consider my time on the sidelines well spent.

~

At any rate, do what you will.

Remember, you are responsible for your decisions, and I am not.  Please take ownership for your actions.

Regards,

pgd

Sunday, July 27, 2014

Allocation Change -- July 28, 2014

.
With the close of markets on Friday, July 25th, my indicators are showing that a more conservative stance should be taken, at least on a short-term basis.

Here are the new allocations:

G-Fund:  25%
C-Fund:  41%
I-Fund: 22%
S-Fund:  12%

The rationale around this shift has many components, but suffice to say that we're seeing a lack of participation of small cap stocks (S-Fund) and a larger push towards the larger caps (C-Fund).

Since the last allocation change (effective June 30) we've remained relatively flat on performance:

C-Fund, 39% allocation, up +0.40%
I-Fund: 9% allocation, down -0.05%
S-Fund:  52% allocation, down -1.15%

The net of these allocations and performance is a loss of -0.79% in the account.

For the same period the S&P500 was up +1.17%.  Of course, hindsight being what it is, it would have been better being 100% in the C-Fund (C-Fund change +1.03%) but my crystal ball is as good as yours.

To show that I eat what I kill, here are the upcoming allocations:


12 month rolling performance is as follows with less than 1% loss in the account.  I've taken a bit more risk in the last several months as I've refined the methods, so I expect gains/losses will increase but the overall risk will remain fairly constant:


~~~~~~~~~~~~~~~

I recently received an email asking how I derive these numbers.  The process is relatively straight forward -- I attempt to maximize forward looking gains against minimizing volatility.  This all has to be done in context of what "the market" is doing now, and as we all know, this is a moving target.

When people say "the market" the little voice in my head asks "which one?".  I say this because different areas of the market act differently at different times.  I measure this using something called correlation -- and the result is a matrix as shown below:


Here, ^GSPC is the Yahoo! symbol for the S&P500, and VXF is the Vanguard Extended Market fund, which is an exchange traded fund, much like a mutual fund.  The C-Fund and ^GSPC (S&P500) have a "perfect" correlation -- they move together, and the S-Fund and VXF also have a perfect correlation.  

In context of "the markets", the real question is what are the expectations of performance given present allocations?  Again, remember that performance has to be measured relative to "something".  

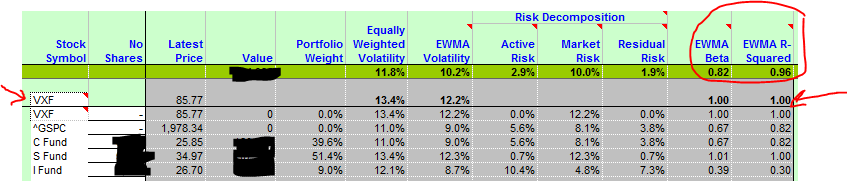
Let's start with the VXF as the benchmark:


I've circled an area that states "beta" and "R-squared".  Beta is the market reference; in this case the VXF is assigned a value of 1.00 and a perfect R-Squared (correlation) of 1.00.  For the portfolio allocations over the past month (since June 30th) the expectation was that, relative to the VXF that the portfolio would perform at 82% of the VXF performance, and that 96% of the portfolio performance could be explained by the VXF movement.  As it turned out, the VXF fell -1.36% over the last month (not shown but available here) and the portfolio actually only fell -0.79%, so we outperformed the market, relative to the VXF.

What about the "other market", the S&P500?  Same process:


Here, ^GSPC is the Yahoo! symbol for the S&P500 market index.  Note that the portfolio allocations over the past month are "hotter" than simply investing in the C-Fund (S&P500) -- the beta of 1.09 indicates that the portfolio has the potential to outperform the S&P500 by about 9% of the S&P500 change.  This is due to the potential of the VXF (S-Fund) allocation - VXF has (typically) greater performance, but greater volatility too.  Adding VXF (S-Fund) adds potential upside/downside, but it also adds risk (volatility).

Te S&P500 went up +1.08% over the last month but the total TSP account fell -0.79%  In hindsight this is a "miss", but remember, this is using today's numbers and applying them backwards.  What if we used the values available only up to June 27th, which is when I last ran the allocation estimates?

The surprising answer is that the beta estimates and R-Squared values are almost unchanged (less than 1% change).  So, sitting back on June 27th, I was looking at 1) how to outperform the S&P500 performance with a high confidence level (expected 9% outperformance of the S&P500 at better than 93% correlation) while minimizing exposure to higher volatility (typically S-Fund, projected allocations said that I would vary at 82% of the S-Fund/VXF variance with a 96% confidence).  The higher performance expectation was derived from the overweighting in S-Fund holdings and by adding C- and I-Fund components I was able to minimize portfolio volatility, lowering overall risk.

From a June 27th perspective I *could* have simply put it all in C-Fund and could have been up +1.03% for the period.  C-Fund had been underperforming the S-Fund up to this period so that didn't make sense.  On the other hand, the S-Fund had been on fire, so overweighting the S-Fund to 100% would have resulted in a loss of -1.36%, so that would have been a terrible miss.  Remember, my crystal ball is as good as yours.

It's all a balancing act -- I'm getting better at it, but it's a moving target.

~~~~~~~~~~~~~~~

Remember, you are responsible for your own investment decisions and I am not.  Please do your own diligence, and please take ownership for your actions.

My allocation changes will be effective with the close of markets on July 28th.

Regards.


Friday, June 27, 2014

Allocation Change - June 27, 2014

.
It's largely moot whether you do this before noon today or noon Monday.  Since we have 2 "free" transfers per month, and we've not used either of them, it's time to change the allocations a bit.

Exposure to Europe and Eurasia has increased risk dramatically, and on a volatility scale, we've moved upward in a dramatic fashion with no rationale for increased gains.  Hence, I'm dropping the I-Fund exposure.

For you conservative types, here are my allocations:

C-Fund:  34%
I-Fund: 8%
S-Fund: 46%
F-Fund: 12%  (or G-Fund, your choice)

I personally think the bond fund (F-Fund) has inherent long-term risk but for now, it will be "ok".

If you are a bit more aggressive, my allocations are:

C-Fund:  39% (unchanged)
I-Fund: 9%
S-Fund: 52%

I've placed my changes and they will be effective as of the close of markets today.

Since our last signal (May 29th) we have the following changes:

C-Fund:  up +1.9%
F-Fund:  up +0.02%
I-Fund:  up +0.53%
S-Fund:  up +3.47%

At the previous allocations, I'm up about +2.1% in the account since the start of the last signal.

~~~~~~~~~~~~~~~

As with all my postings, these are for informational purposes only.  You are responsible for your own decisions, and I am not.  Please do your own diligence, and please take ownership for your personal actions.

Regards,

pgd

Thursday, May 29, 2014

New Long Signal, May 29, 2014

.
With the close of markets on Thursday, May 29, 2014, my timers have all signaled "long".  This means that I am transitioning from the TSP "G Fund", which is essentially a money market, into the equity funds.

If you are conservative you may want to consider a position in the F-Fund, which is a bond fund.  The F-Fund is up 1.11% over the past month, due mostly to the weakness of equities, but with the summer months here it could be a slight hedge against the equity markets.  Of course, you could leave a position in the G-Fund and lower your risk by that amount.

Representative "Conservative" positioning would be along the lines of:

F-Fund:  12%
C-Fund:  32%
I-Fund:  26%
S-Fund: 30%

Because Kari has a long number of years before she can tap these monies, we're more aggressive.  Our allocations for the next leg are:


C-Fund:  39%
I-Fund:  26%
S-Fund: 35%

Note that there is no position in the G-Fund (money market) or F-Fund (bonds).  We are fully exposed to the market with this allocation.

The change has been made -- if you make the change before noon EDT on 5/30/2014 it most likely will be made Friday night and will count against the May transfer allotment of 2 transfers per month.  This means we are starting June with a clean slate, which is always welcomed.

As always, you are responsible for your investment decisions and I am not.  Please do your diligence, and please take ownership for your actions.

Regards,

pgd

Saturday, April 12, 2014

April 11 2014 Signals a Move to Cash

.
Our TSP portfolio is at least 11 years away from being tapped, so we have a longer-term view than many who read these notes.  This being stated, I have a number of signals that I employ on the short-term, intermediate-term, and long-term basis that help me to move in and out of the fund.

Back in March I published on my sister blog that my intermediate timer was moving to CASH.  The short-term timer had already transitioned a few days earlier.  The short-term timer is not appropriate for TSP fund management -- we are only allowed 2 transfers per month, and any third transfer would have to be to the G-Fund, which is effectively a cash position.  The short-term timer is literally that -- it can move in a few days in and out, and this is counter to the design and goals of the TSP program.

The intermediate-termed timer is more applicable to the TSP program, but note, even it can move in and out a few times per month, although this rarely occurs.  When it does though you're at a bit of a disadvantage, as you have to wait until the first of the next month to move back in to the long side, and this can miss the initial burst off the bottom that occurs with a new long signal.

I used the March 2014 intermediate signal to reallocate with a higher percentage of CASH in the TSP -- some of you may have moved to 100% cash -- I don't know.  I've watched the account drop about -2% since the signal and a bit more than -3% since the March 6 peak, and while I hate any form of giving up gains, to make money you have to have money in play.

With the events of the recent week we've seen a slightly different behavior, and the result is that my last safety net -- the good ole "13d MA crossing the 65d MA from above" has occurred.

What does this mean?

Well, first, it means you need to pay attention.  If you are retired and you are living on a fixed income, yet have money in the market, you should most likely think about how much risk you're willing to take.  Right now risk is high, and the potential reward for taking that risk, at least in the short term, is pretty poor.  This is not the way you make money in the long haul.

When I was doing my GGT seminars for folks, I used to cite the following statistics:

"If your stock falls X, you need Y gain just to break even"

X            Y
-5%         +5.3%
-6%         +6.4%
-7%         +7.5%
-8%         +8.7%
-9%         +9.9%
-10%       +11.1%
-15%       +17.6%
-20%       +25%
-25%       +33%
-33%       +50%
-50%       +100%

The above should help you dial in what you need to be doing in terms of your individual risk profile.  How many of you have made 10% consistently in a year?  If you've been in the broad market you're looking at having to make this amount over the next year just to return to the March 6th high level.

The GGT index is down -8.3% since it's March 6 high.  I've been 38% in cash in the TSP account since mid-March, so I've only seen a portion of this decrease.  Nevertheless, it's still a decrease. Management is key from this point forward.

This 13d/65d timer is my safety net.  If you have something that can beat the following figure, I'm all ears (eyes, whatever):


Right-click on the image to open in a new tab or window.

What is crucial here is that downdrafts are swift, while grinding to the upside takes time.  Yes, if you're out of the market you'll miss the bottom and the turn.  Yes, you'll miss the rise off the bottom.  Eventually, the markets will turn, and trend-following systems will get you back in.

Whipsaws, or going back-and-forth in the signal, is common.  We whipsawed Feb 3 - Feb 14th with this timer.  It could happen again.  Note though that the absolute shortest long-cash-long or cash-long-cash whipsaw was 8 days, and this is since September 2008.  I imagine we'll be here at least this week, and maybe for several weeks or months.  My crystal ball is as good as yours.

I have placed an order to move 100% of our TSP funds to the G-Fund.  This is CASH.  This will execute on Monday, independent of whether the market is up +3% or down another -3%.  It doesn't matter.  I follow the signal, and as my last safety net, this one is saying get out.

For now, I'm out.

Regards,

Paul

Thursday, March 27, 2014

End of Month Allocation Change

.
It's the end of the month and I'm reallocating our TSP as follows:


I'm dropping the cash (G-Fund) component by 10% and allocating more heavily to the S&P 500 (C-Fund) as well as the EAFE (I-Fund).  What we're seeing in this downturn is a shift away from faster-moving small-cap stocks (S-Fund) into more traditional blue chip stocks (C-Fund), where greater safety typically resides.  The reduction in G-Fund is simply because I want to play a bit more in the market as we've dropped a few percentage points from the last time we made an adjustment.  As the market drops, you should buy the dips, especially if your horizon is longer-termed.

While my crystal ball is as good as yours and I have no idea if this recent pull-back is temporary or will continue, I want to take advantage of the "free" shift that we get at the end of the month.  If you make the transfer by noon on 3/31 you'll start April with your two-allowed-transfers available.

Performance has been slightly negative over the past 45 days, but if we're not in the market, we can't play the market.

Adjust your percentages according to your risk tolerance.  Kari and I have many years before we can tap these funds so our risk tolerance may be higher than yours.

Remember, you are responsible for your investment decisions and I am not.  Take ownership of your actions.

Regards,

pgd