Tuesday, October 19, 2010

10OCT19 -- POTENTIAL MOVE TO CASH SIGNAL

.
Folks,

With the close of the markets today, Tuesday, October 19th, we have a move to cash signal for EFA/I-Fund, SPY/C-Fund, and although a weaker signal, for the VXF/S-Fund.  Note that GGT has NOT confirmed this transition -- these signals are being derived from Elder's 13d Force Index method as well as my 13/34d slope method. 

First, here is what GGT has to say about the TSP ETFs:


As far as GGT is concerned, we are still above historical, optimized price and volume levels so holding these ETFs is still a valid position (obviously with the exception of AGG/F-Fund).

When we dig deeper using a different method, we get a different picture.

EFA / I-Fund:


  • Price closed below the 13d EMA after obeying this line for 7 weeks.  For the conservative, this is a sell signal.  For the aggressive, if tomorrow has any point in the day below today's low, then we have a confirmed sell signal.
  • Elder's FI(13) signal closed negative.  This is an automatic sell of any security.
  • MACD Histogram has moved negative.  This is an automatic sell of any security.
While not shown in the graph above, the slope of the 13d EMA has crossed the slope of the 34d EMA from above, also signalling severe weakness.

The link to this chart is here.

SPY / C-Fund:


While the price of the SPY did not close below the 13d, we do have two indicators shown that signal danger for this equity:
  • Elder 13d Force Index is negative, which is an automatic sell signal
  • MACD histogram has just transitoned negative, which is an automatic sell signal
Again, while not shown, the slope of the 13d EMA is crossing the slope of the 34d EMA from above.

These three indicators, taken together, are enough for me to transition to cash for SPY / C-Fund. 

The link to the SPY chart is here.

While we're here, we might as well take a look at VXF / S-Fund:


The price closed right on the same value as the 13d EMA, so technically, it has not violated the 7-week rule.

The Elder FI(13) value is still positive.

Not shown is the crossing of the slope of the 13d EMA and the 34d EMA from above.  This is an automatic sell signal.

The MACD histogram is newly negative, which is an automatic sell signal.  Combined with the slope 13x34 from above, we have a confirmation. 

The link to the VXF chart is here.

===============

I am a conservative investor so I will sell my positions in EFA/I-Fund, SPY / C-Fund, and VXF / S-Fund and transition everything to cash / G-Fund.  The markets may recover and move higher from here, in which case we still can use one of our transfers to get back in the market and we may miss a couple of days of run up.  I had rather do this than lose the 6% that we have gained since the beginning of September.

Place your order by 9 a.m. EDT if you want TSP to enact the transfer on the close of business on Wednesday.

===============

Remember, you are responsible for your own trades, not me.  Please do your own diligence.

Regards,

pgd

Saturday, October 16, 2010

AGG / F-Fund in CASH, All Others LONG

.
Overall, the GGT system, as applied to the TSP, is still LONG on EFA (I-Fund), SPY (C-Fund), and VXF (S-Fund).  AGG (F-Fund) has transitioned to CASH.  Here's my dashboard view; as with all my images, right-click to open in a new window or tab within your browser:


If you are investing in AGG/F-Fund I recommend that you review those holdings immediately, as you are losing value rapidly.

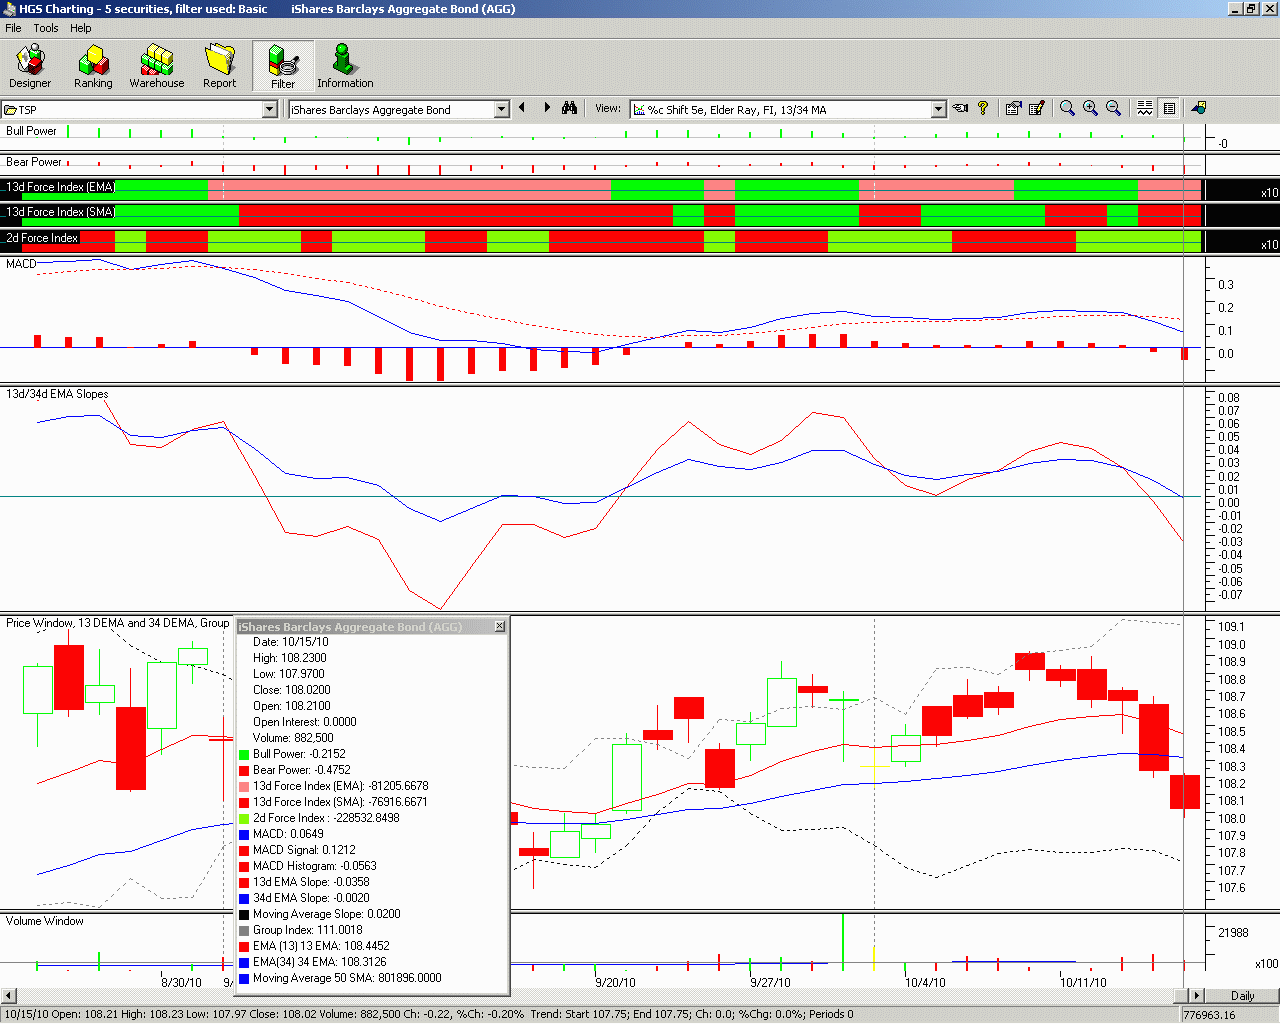
Here is a view of AGG for discussion:


There are a number of reasons you should seriously consider moving out of AGG/F-Fund:
  • Bull Power is negative.  Bull power is Dr. Alexander Elder's creation, and it calculated by subtracting the 13d exponential moving average (EMA) of price from the day's high.  When the day's high is below the 13d EMA, this value is negative.  This means that the bears are winning.
  • Bear Power is negative and more negative than Bull Power.  Like Bull Power, this is calculated by subtracting the day's low from the 13d EMA of the stock.  The more negative, the more the bears are in control. 
  • Elder's 13d EMA and SMA (Simple Moving Average) on the Force Index are both negative.  The Force Index (FI) is calculated by taking the change in daily price multiplied by the volume of the day.  The FI(13) is calculated by taking the EMA or SMA -- I show both.  When these two transition either way on the same day we have a powerful signal, and as you can see, they both moved below 0, which is bearish, two days ago.
  • MACD histogram is negative.  This equity has lost bullish momentum and is accelerating to the downside.  It will bottom eventually, but it will take you with it.
  • The slope of the 13d EMA on price has crossed below the 34d EMA on price.  We are losing price value rapidly on these two time scales.
  • The 13d EMA slope is negative, which is bad.
  • The 34d EMA slope has just turned negative, which is bad.  The combination of these two confirm that "the car is driving backwards and it is accelerating backwards"
  • The "slope of the slope" of the 13d and 34d EMAs are pointing downward.  Not only are we losing price value rapidly, we are accelerating to the downside.
  • Price is trading below the 13d (recall Bull/Bear Power) as well as the 34d EMAs.  As of Friday's data there is no floor in sight.
Again, I see no compelling reason to hold AGG/F-Fund.

==============

With respect to the other funds, they are LONG in general, but looking at the aggregate chart, they look "toppy".  Here's what I'm seeing:


This view is created by equal-weighting the EFA (I-Fund), SPY (C-Fund), and VXF (S-Fund).

As you can see, the price index for this grouping is at $164.  If you look above that area, you see that the 13d EMA slope is changing (positively) at $0.53/day and the 34d EMA slope is changing (positively) at $0.44/day.  This is healthy.

Of notice is that the 2d Force Index -- FI(2) -- has moved negative with Friday's action.  The large price change of the index, coupled with the higher-than-normal volume, has caused this value to drop below 0, which is either 1) a warning shot, or 2) a buying opportunity.  1) occurs if we do not close above the price index value on Monday and possibly continue to fall, and 2) occurs WHEN we close above the previous day's high.

This run has been strong and we can only follow the trend after it prints the day's actions, so simply be alert.

I am fully invested using the three funds in this account.  Since our buy signal was generated at the end of September 14th we have experienced the following increases to the individual positions:

Index (equal weighted):  +5.9%
EFA (I-Fund):  +7.3%
SPY (C-Fund): +4.6%
VXF (S-Fund): +6.9%

My actual portfolio has increased  +5.98% in this time frame.  If you follow me, yours should be doing the same too.

================

Trading Plan for the Next Week

Basically, do nothing and stay on autopilot.  My new contributions are going in at
  • 29% for the C-Fund,
  • 36% for the S-Fund, and
  • 35% for the I-Fund.
as this is the present allocation of my holdings.

================

Remember, you are responsible for your own trading decisions, not me.  Please take personal ownership for your trades.

Regards,

pgd

Thursday, September 30, 2010

End of September Rebalance? Not Necessary ...

.
Here at the end of the month I would like to re-examine whether we should rebalance.

The short answer is no; I intend to stay the course.

Since our move from the G-Fund on 9/14 we have the following performance:

F-Fund:  -0.2%
C-Fund:  +2.17%
S-Fund:  +3.68%
I-Fund: +2.60%

Overall, I do not invest in the F-Fund, as bonds simply are not going anywhere and all it does is dilute my funds available for the C/S/I funds.

I suggested the following weighting on 9/14, and this weighting is unchanged:

C-Fund/SPY:  29%
S-Fund/VXF:  36%
I-Fund/EFA:  35%

When you weight the performance since the close of 9/14 through the close of 9/29 the net return is +3.30%.  Yes, I missed the run-up of 9/1/10 due to being on vacation; despite this, I am quite pleased with a 3.3% return for the month (not including what the G-Fund contrinuted).

Stay the course for now.

=======================

Remember, you are responsible for your own trading decisions, not me.  Please do your own diligence.

Regards,

pgd

Tuesday, September 14, 2010

New Long Signal for S-Fund and C-Fund

.
With the close of the markets on Monday, September 13th, 2010, we have a new long signal simultaneously appearing in the VXF (S-Fund) and SPY (C-Fund).  The EFA (I-Fund) already was long, although I had not transitioned to this signal because of my vacation late August.

Although I do not trade the AGG (F-Fund), it is affirming a position in CASH.

Allocations for the 3-fund portfolio (C-Fund, I-Fund, S-Fund) are as follows:

EFA / I-Fund:  35%
SPY / C-Fund:  29%
VXF / S-Fund:  36%

Allocations for the 4-fund portfolio are as follows:

AGG / F-Fund: 4% -- KEEP IN CASH (G-Fund), not in F-Fund.
EFA / I-Fund: 33%
SPY / C-Fund: 28%
VXF / S-Fund: 35%

============================

Remember, you are responsible for your investment decisions, not me.  Please do your own diligence.

Regards,

pgd
Tuesday, August 31, 2010

Moving All Funds to G-Fund

.
As of today (August 31st), I am placing an order to move all my wife's funds to the G-Fund.  Rationale:

1) All of the equity funds (VXF, SPY, EFA) within the TSP Universe are in Affirmed Cash or Cash, indicating a very bearish condition
2) All of the equity funds within the TSP Universe have a 13d and 34d downward slope on the price EMA, so they are losing money on those time frames
3) I'm leaving on vacation, and I don't want my wife's monies exposed when I cannot do anything about it.

I'll look at reallocation upon my return.

Regards,

pgd

Monday, May 31, 2010

Memorial Weekend Update

.
Status:

F-Fund / AGG:  sustained up trend
I-Fund / EFA:  avoid
C-Fund/ SPY:  avoid
S-Fund / VXF: avoid

==================

Last week I informed you of my decision to move some monies LONG out of the G-Fund / cash, simply because the market had fallen.

Here, at 1-week plus, are the actual allocations in my TSP are as follows:
  • G-Fund: 73.78%
  • F-Fund: 0%
  • C-Fund: 9.98%
  • S-Fund: 14.25%
  • I-Fund: 1.99%
To save you from looking back, the target allocations are:
  • G-Fund: 74%
  • F-Fund: 0%
  • C-Fund: 10%
  • S-Fund: 14%
  • I-Fund: 2%
Not that one week makes a success, but we do have significant gains in the S-Fund, relative to the losses in the other funds, so I'm pleased.

I intend to keep this allocation for now.  Let's run down the ETF equivalents of these funds:

AGG / F-Fund

Overall, the AGG / F-Fund looks relatively strong.  Here's the chart (as with all my charts, click on the image for a larger view):


Focus on the lines in the "65d EMA Slope" window.  This graph is constructed by:
  1. Take the 65d EMA of the price series
  2. Take the slope of this 65d EMA 
  3. Smooth the slopes using a 2d EMA (red), 8d (blue), 13d (green), 21d (black), and 34d (purple)
Here's what I'm looking for as a continuation of the trend:
  • All the trend lines are pointing upward.  This is true for all but the 2d & 8d.  The 2d is showing a bit of a pullback, which is okay as long as it remains above the 34d EMA, and the 8d just started trending downward, showing some short-term weakness.  I'm not in the F-Fund/AGG, but if I were, I would not be overly concerned at the present time.  This is a strong up-trend.
  • All the EMAs are positive.  This *is* the case and indicates that for *all* the EMAs, prices are appreciating for AGG
If you take a look at the lower pane which contains the price series, you'll see the 50d MA (blue) and the 200d MA (red).  
  • Both are in an uptrend (e.g., sloped upwards -- bullish)
  • The 50d > 200d -- bullish
Given the data that we see here, we can only conclude that AGG is bullish and there is no reason not to hold this fund / ETF.

==============

C-Fund / SPY


The graphic above shows the ETF SPY, which is a proxy for the C-Fund.  We're seeing very new bullish behavior in the 2d and 8d 65d slopes, but overall, we are in a significant downtrend on the SPY and aside from our target 10% position due to a 10% pullback (coincidence that these values are the same), we should avoid this equity.

Note that the 50d MA (blue) is in a downtrend, and that the prices are trading below their 200d MA.  Both of these latter indications are intermediate-term bearish.

I also note that with the exception of the 34d EMA of the slope line, all the other slope EMAs are well below 0, which is very bearish.

===============

S-Fund / VXF


The 65d slope lines look very close to the SPY and the conclusions are equivalent -- VXF / S-Fund, except for our l4% target, should be avoided.

I note that the 50d MA is also pointing downward, which is bearish.

================

I-Fund / EFA


EFA / I-Fund is very weak on numerous fronts:

  • the 50d MA (blue) is in a downtrend
  • the 200d MA (red) just started a downtrend
  • all the 65d MAs are less than 0 and with the exception of the 8d, are all heading lower
I am avoiding the I-Fund except for the 2% position that I have at the present time.

I note that the high on 4/14, coupled with the low on 5/25, saw the EFA with a -21% change.  IF we see any weakness in EFA I will add to the 2% position in EFA / I-Fund from the G-Fund, and perhaps will perform a rebalance.  Stay tuned.

==============

Remember, you are responsible for your own trading decisions.  Please do your homework.

Regards,

pgd

Thursday, May 20, 2010

Allocation Change to Portfolio

.
I've been doing some testing with the ETFs that correspond to the Funds of this portfolio, and there is a significant performance gain if we scale into the drop of the overall markets.  This is because instead of waiting for the LONG signal to be generated, we will be purchasing shares at increasingly cheaper prices, ensuring that we participate in a reversal, when it occurs.

THIS METHOD RELIES ON YOUR BELIEF THAT OVER THE LONG TERM, MARKETS WILL RECOVER AND MOVE HIGHER.

Here are the rules that I am playing with:

  1. If ETF has a LONG recommendation, invest according to the last calculated allocation.  For example, AGG / F-Fund is presently considered a LONG, hence for the 4-ETF/fund portfolio, your allocation would be 48%.
  2. If the ETF has a CASH recommendation, AND
  3. If the ETF has fallen 0 - 10%, then DO NOTHING (keep funds in cash),
  4. ELSE IF the ETF has a CASH recommendation, AND
  5. If the ETF has fallen -10% or less (e.g., more negative), the transfer from cash 2x the amount from the most recent high to the present low, in terms of percentage decrease.

    For example, the EFA / I-Fund has fallen about 19%, hence the scale amount is 2x19% = 38%.  Because the recommended allocation of EFA is 3% for the 4-ETF/fund portfolio, and 6% for the 3-ETF/fund portfolio, you would transfer 38%*3% = ~1% and 38%*6% = ~2%.

    The SPY/C-Fund has fallen about -11.5%, hence the scale amount is 23%.  The recommended allocation for SPY is 23% for the 4-ETF/fund portfolio, and 44% for the 3-ETF/fund portfolio, you would transfer 23%*23% = ~5% and 23%*44% = ~10%.

    The VXF/S-Fund has fallen about -14%, hence the scale amount is 28%.  The recommended allocation for VXF is 26% for the 4-ETF/fund portfolio, and 50% for the 3-ETF/fund portfolio, you would transfer 28%*26% = ~7% and 28%*50% = ~14%.
  6. If the ETF has a CASH recommendation, AND
  7. If the market continues to decline after Step 5 is performed, for every -10% decline in the market, reallocate at the next scale amount.

    For example, the VXF has fallen about -14% to date.  When it falls -20% total decline, we would ensure that a 40% scale of the present allocated amount (26% if using today's recommended allocation for the 4-ETF/fund portfolio, e.g. 40%*26% = 10%, and 50% if using today's recommended allocation for the 3-ETF/fund portfolio, e.g. 40%*50% = 20%).
  8. Continue steps 6 and 7 as the market moves down.  After the market transitions to a 50% loss, you will be 100% invested (no monies in cash).  The likelihood of the market continuing below 50% is very low, but as we saw in early 2009, it certainly can happen.
  9. Once the ETFs signal a LONG call, reallocate the individual ETF/Fund as per the recommended amounts.  Do NOT disturb the ETFs/Funds that continue to have a CASH recommendation, e.g., keep their present allocations.
In accordance with the preceding rules, I have affected the following portfolio transfer, which will most likely occur Friday, May 21st:

4-ETF / Fund Portfolio
  • AGG / F-Fund:  48%
  • EFA / I-Fund: 1%
  • SPY / C-Fund: 5%
  • VXF / S-Fund: 7%
3-ETF / Fund Portfolio
  • EFA / I-Fund: 2%
  • SPY / C-Fund: 10%
  • VXF / S-Fund: 14%
As always, you are responsible for your own trading decisions, not me.  Please do your homework.

Regards,

pgd