Thursday, October 30, 2014

End of October Allocation Changes, 10-30-2014

.
10/31/2014 Morning Update:

I fat-fingered the S-Fund -- the correct value is in bold (51%, I had listed 59%).

~~~~~~~~~~~~~~~~~~~

Effective with the last day of the month, I'm moving my allocations to:

C-Fund:  39%
I-Fund:  10%
S-Fund:   51%

These are aggressive values, as nothing is being held in G-Fund.  My time horizon is longer than most (11 years), so I can afford to take a bit more risk.

If you are more conservative, allocations which include holding some back in cash are:

G-Fund:  25%
C-Fund:  29%
I-Fund:  7%
S-Fund:  39%

Equally-blended in the C-, I-, and S-Funds (e.g. 33% each) produced these results since 11/25/08:


For those of you who are following my movements, I use a timing system that is applied to the numbers above.

~~~~~~~~~~~~~~~

I have made the changes in my TSP account.  As long as the changes are posted by 12:00 pm on Friday they will apply for October and will NOT count against the 2x transfers we can use in November.

~~~~~~~~~~~~~~

As with all my postings, you are responsible for your own investments and I am not.  Please do your diligence, and please take ownership for your actions.

Regards,

pgd


Friday, October 10, 2014

Reversal Signal - Thurs, Oct 9 Close Update

.
I entered the TSP funds with the close of markets today, only to have yesterday's signal reverse.  All indications are "back to cash".

As I indicated yesterday, the initial entry position was 50% cash, 50% equities.  I'm now there.  The reversal indicates that we should transition back to cash, BUT, if I do this, I cannot invest for the rest of the month since we only get two transfers per month.

Correspondingly, because my time frame is long, I'm sitting pat with the allocations established yesterday.  I intend to stay the course.

Of course, your actual mileage may vary.

~~~~~~~~~~~

Standard disclaimers apply.

Regards,

pgd

Wednesday, October 8, 2014

New Entry Signal, Wednesday, October 8th Close

.
With the close of markets on Wednesday, October 8th, we have a new buy signal for the TSP portfolio.

This is an early signal, and my cash requirements suggest that no more than 50% of the account be placed in equities.

Given this allocations for Thursday, October 9th are:

G-Fund:  50%
C-Fund:  32%
I-Fund:  12%
S-Fund:  6%

This is a conservative allocation, and it is very possible that if this run continues we could see a fully-invested amount quite soon.

This will use one of the two transfers that we have available for the month of October.

~~~~~~~~~~~~~~

As with all my postings, you must do your own diligence and take ownership for your own trades.  Please accept responsibility for your actions.  I have no responsibility for what YOU do with YOUR money ... this is simply what I'm doing with MY money.

Regards,

pgd

Tuesday, September 30, 2014

Tuesday, Sept 30 Morning Update

.
No changes.

I indicated that I would look deeply at the end-of-the month signal I just received that moved me to 100% cash and that I would post whether some equity position was required.

We have 2 transfers per month available with the TSP funds.  These transfers can be however we choose, but the final transfer must be a sweep to cash (G-Fund).  It would be nice to use the available transfer (today before noon EDT) and leave two transfers for October.

While I believe that we are experiencing end-of-the-month and end-of-the quarter window dressing, and that historically, the first few weeks of October are generally positive, there is nothing in my indicators that says we should move into the markets.  There is a risk/reward component to this, and when I move against my indicators, it becomes speculation, not investing.  If I moved into the equity funds today it would be pure speculation.

I'm sitting 100% in the G-fund, and will end the quarter this way.  The next signal to move into the equity funds could be tomorrow (October 1) or it could be much, much later.  Your crystal ball is as good as mine.  Invest in the markets that are presented to you, not the one that you want.

Regards,

pgd

Thursday, September 25, 2014

Moving to 100% G-Fund, Thurs, Sep 25th Update

.
Effective with the close of markets on Thursday, September 25th, my indicators are showing that I need to move to 100% cash.

I am moving all TSP monies to the G-Fund, effective with the close on Friday, 9/26.

I will use the weekend to evaluate if we need to use our 2nd transfer to some form of equity balance -- right now, the answer is cash.

~~~~~~~~~~~~~

As with all my ramblings, you are responsible for your own trading/investing decisions and I am not.  Please do your own diligence, and please take ownership for your actions.

Regards,

pgd

Thursday, August 14, 2014

Signal Change with 8/13 Close

.
Pushed for time today so this will be brief.

With the close of markets on Wednesday, 8/13, the TSP allocation has signaled a change to LONG.

The signals are weak and mixed, but they are over the threshold and hence, I'm compelled to move long.

Here are the allocations:

Conservative
AGG F-Fund 38%
SPY C-Fund 27%
EFA I-Fund 11%
VXF S-Fund 24%
100%
Aggressive
SPY C-Fund 44%
EFA I-Fund 18%
VXF S-Fund 38%
100%

My horizon in long-term (greater than 10 years) so I am aligning myself with the Aggressive portfolio.  Changes made in my TSP account by 12:00 ET will be effective tonight.

~~~~~~~~~~~~~~~~

Obviously, do your own diligence.  You are responsible for your investment decisions and I am not.  Please take ownership for your actions.

Regards,

pgd 
Wednesday, August 6, 2014

8/5/2014 Signals Transition to Cash

.
I'm on the road this week so keeping up on the market has not been as easy as you may think.

With the close of markets over the past few days, and confirmed on 8/5, my indicators are showing that it's time to move to cash and wait for the storm clouds to pass.  There are a number of indicators that are bearish, and getting all of these to "line up" is relatively rare except at market transitions.

Of course, your crystal ball is as good as mine.

Since ALL my fail-safe indicators are now bearish, my trading plan has me moving to 100% cash.  I have no choice in the matter, as the system has worked for years to keep me out of trouble, especially in the 2008-2009 time frame.

BUT, if you are inclined to consider that we dropped very quickly and are technically oversold and could have a bounce here, a possible good allocation is as follows:

CASH (G-Fund):  53%
S&P500 (C-Fund):  28%
International (I-Fund): 8%
Small-Cap (S-Fund):  11%

I personally am not following these allocations and I will not be tracking the performance of this mixture going forward.  I also will not use these numbers to influence future allocations.

Although I have numbers for a non-cash stance I'm not going to provide them -- I think they are too aggressive and simply do not consider that we're in a downward momentum phase of the markets.

~~~~~~~~~~~~

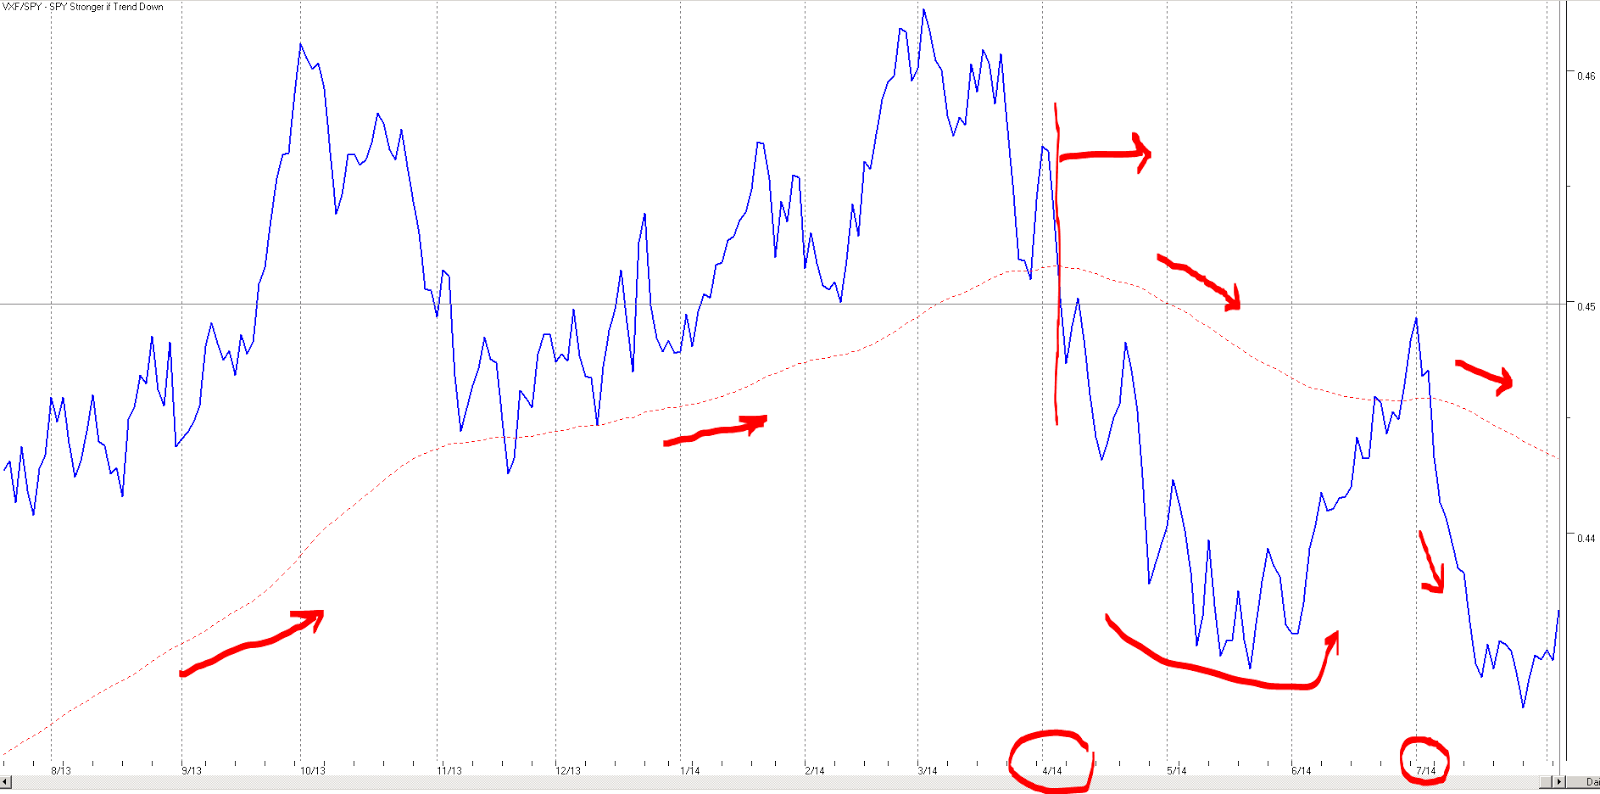
There is no doubt in my mind that we're seeing a transition to safety on a longer-term basis, and this means that we're entering a new phase of the market.  This is best illustrated by a relationship that I follow which is the VXF ETF (which represents all the stocks in the market except those in the S&P500) and the SPY (which is the S&P 500 SPDR).  Typically, the VXF is considered a "small cap" fund, where the SPY is considered large caps.  Indeed, if you look at the individual holdings of each of these ETFs and sort by market cap you can see that the SPY dominates VXF in overall total market cap.

Here's the graph:


Right-click on the image to open in a new tab or window.

The first thing to realize is that up until around the middle of April, the longer-term trend line showed that VXF was outperforming the SPY.  There were short-term violations of this concept, but the trend remained intact until mid April.  As you can see in the graph above, the trend line has now taken on a downward slope, which means that the SPY is outperforming the VXF on a 65d time frame.  There will be short-term violations of this statement too, but in general, money is moving to safety.

The implication for the TSP funds is that going forward we want more allocation to the C-Fund and away from the S-Fund, at least on a medium to long-term basis.

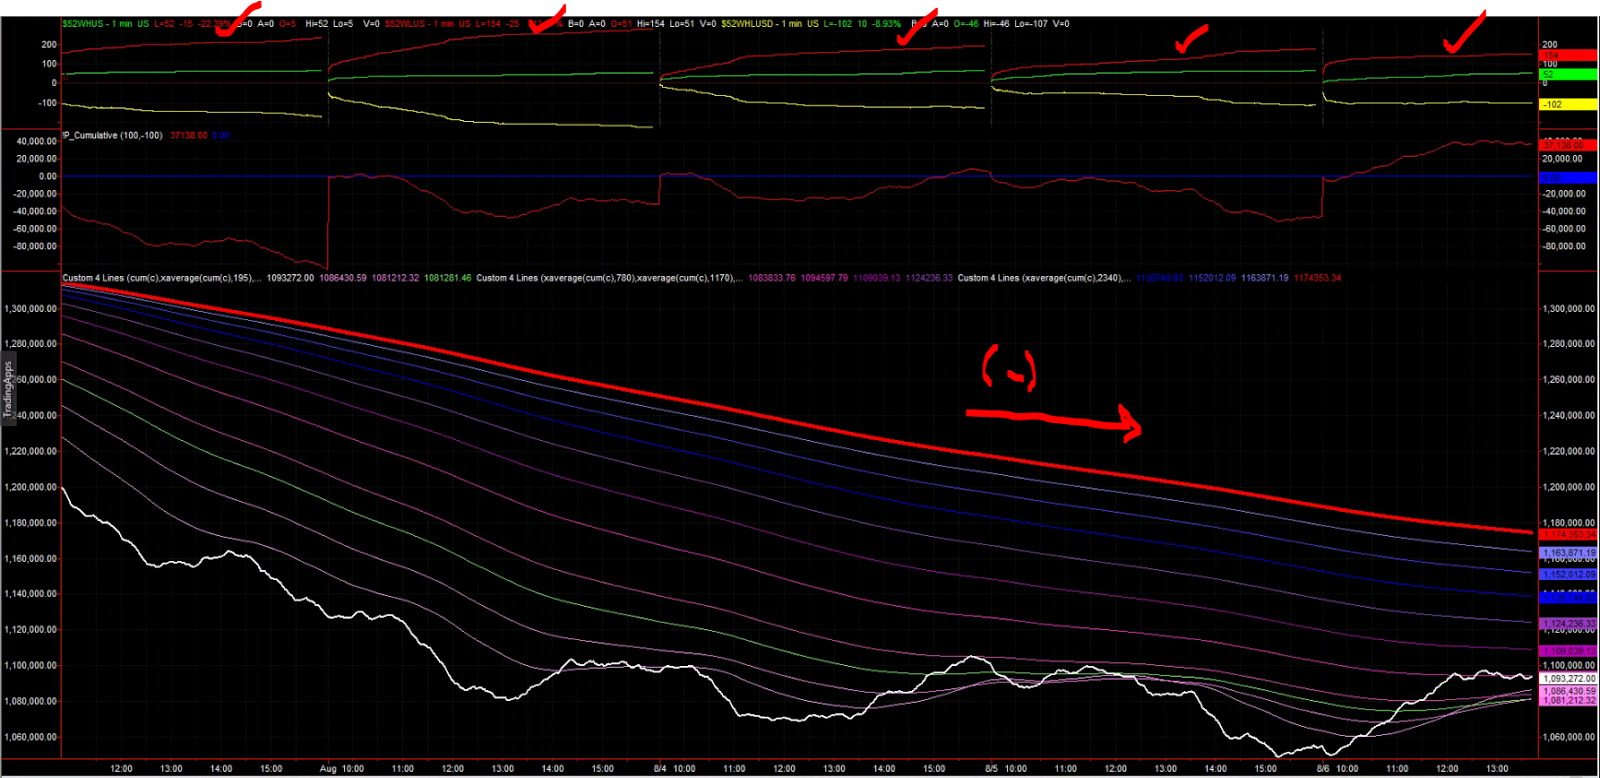
The next indicator that I use, which has not been in this territory for some time, is called a Cumulative Tick Ribbon.  Essentially, this is a cumulative count of minute-by-minute transactions on the major exchanges, and it tallies whether all the stocks for a specific "tick" are increasing in price or decreasing in price.  When you average these over multiple time frames you get an interesting view:


Right-click on the image to open in a new tab or window.

Ignore the top two panels and simply look at the bottom panel.

The white trace is the real-time, non-averaged value.  The red trace is the longest time frame that I average, about 10 trading days.  The negative slope of this line is troubling -- it simply tells me that on this time frame that we're down significantly.  Further, since the slope is relatively constant for all the days shown, it tells you that we're not out of the woods yet.

Your eye may catch that the real-time, non-averaged value appears to have stabilized into a range.  Yes, this is indeed what we are seeing, so perhaps we're at a bottom.  We could also be at a pause with a potential to continue downward -- I simply do not know.  Best to be prudent and protect gains.

The top panel in the figure above shows the number of NEW LOWS (red), NEW HIGHS (green), and difference between the two (yellow).  This is over the past 52 weeks.  The figure shows, without any ambiguity, that we are solidly hitting NEW LOWS on a day-over-day basis.  Until that green line starts dominating the red line, I'll consider my time on the sidelines well spent.

~

At any rate, do what you will.

Remember, you are responsible for your decisions, and I am not.  Please take ownership for your actions.

Regards,

pgd