Wednesday, April 20, 2011

GGT Risk Model Signals a Complete Transfer to CASH

.
Summary

  • In intend to move 100% of my wife's funds to CASH, effective with the close today.  New contribution allocations will be 100% into CASH.
===================


TSP Status

With the close of markets on 4/19/11, the GGT risk model has indicated that the C-Fund should be liquidated to cash.  This is presently 98% of my holdings.

The natural question is now one of re-allocation between the remaining funds:  F-Fund, I-Fund, and S-Fund.  To answer this, it is important to understand where we are.


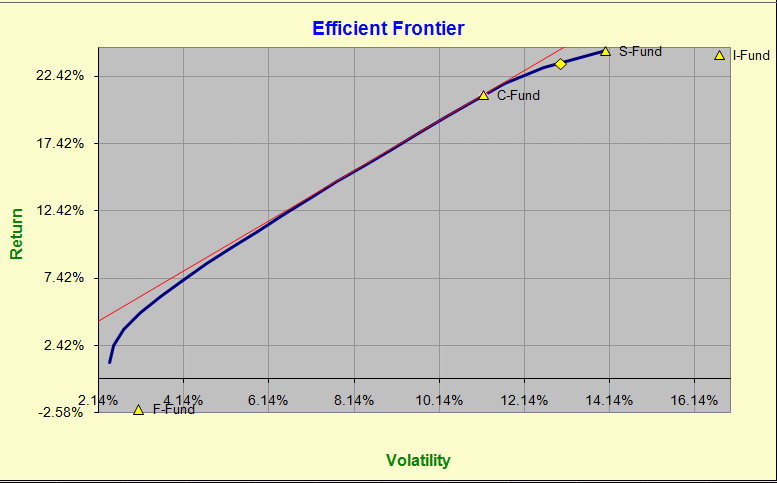
The graph above shows the return/volatility universe for the 3 equity funds available within TSP.  Actual TSP data is used, e.g., proxy ETFs data was NOT used.  The blue curve represents all the different combinations of C-Fund, S-Fund, and I-Fund that we can achieve within our portfolio.  The unlabeled yellow diamond, located on the blue curve between C-Fund and S-Fund, is where we are today with our present portfolio.  Note that the F-Fund is on the bottom of the figure, with an annualized return of less than 0%.

The analysis starts simply by asking the question "what combination moves us up greater than the return of where we are but does so at lower risk?  We are already at 98% C-Fund, 1% in each of the S-Funds and I-Funds.

The math is complicated but there is no way to get greater projected return at lower risk than where we are today.  This is because we are presently sitting on the blue curve -- we already have a portfolio that is extremely efficient.

The next part of the analysis looks at an adaptive moving average of each of the prices of the C-Fund, I-Fund, S-Fund, and F-Fund.   When prices are below the moving average, we should sell.  When prices are above the moving average, we should be long.  It's a simple system and does not issue changes all that often (e.g., the C-Fund only offered 5 signals to move to CASH in the last 365 calendar days).

Right now the C-Fund has issued a signal to move to CASH, and this is confirmed for two consecutive days. The I-Fund and S-Fund are still long.

Strategy

The TSP funds offer the ability to exchange only 2x per month.  This signal today will be 1 of those 2 exchanges.

I fully intend to move the C-Fund to cash.  I will place the order at www.tsp.gov before noon EDT so that it is effective today.

The question now is what to do with the I-Fund and S-Fund allocations of 1% each.

In the risk-adjusted model, and with an eye towards the figure above, you can see that the I-Fund has greater volatility but has lower return over the past 100 days, when compared to the S-Fund.  The calculations (not presented here) for allocation to the I-Fund ZERO any allocation in the I-Fund, as the volatility is increasing and return is decreasing.  This is bad for our portfolio.  This forces me to conclude that the money in the I-Fund will be moved to CASH.

This leaves 1% in the S-Fund.  The risk-adjusted model actually indicates leaving this 1% intact, as a 100% allocation in the S-Fund falls directly on the blue-curve.  99% in cash simply lowers our risk of being in the S-Fund by .... wait for it ... 99%.  Bottom line, if you want to leave some money in the S-Fund go ahead, but to align with the model, you probably should not have much in there at all (e.g., no more than 1%).

I personally intend to move 100% of everything to the G-Fund, which is CASH.  No sense worrying about the 1%.

=================

Performance

The rolling, day-for-day 12-month realized performance of this strategy is 10.16%, as measured by www.tsp.gov.  The drawdown, or the maximum value attained in equity to the lowest point since the peak is -1.1%.  This gives me a reward/risk ratio of 9.24, and anything over 3.0 is considered outstanding.  There is virtually no ulcer index with this strategy, which means I sleep well at night.

Since my last long signal on 3/28/11, I have realized the following performance with my stated allocations:

  • close of 4/19/11:  gain of +0.302%
  • total trading days of signal: 17
  • maximum equity peak during 3/28 - 4/19:  +2.04% on 4/6
  • maximum equity dip during 3/28 - 4/19: -0.269% on 4/18
  • if 100% invested in G-Fund during same period:  +0.183%
Overall, this isn't a great performance -- the risk-free approach is nearly the same as my achieved gain.  I do note that in terms of daily change of the portfolio that we have the following averages over the last 17 trading days:
  • G-Fund:  +0.011%/day
  • F-Fund:  -0.052%/day
  • C-Fund: +0.019%/day
  • S-Fund: +0.041%/day
  • I-Fund:  +0.032%/day
  • 98% C-Fund, 1% S-Fund, 1% I-Fund: 0.000%/day
I achieved virtually no volatility over the past 17 trading days, which is what I desire to do with this portfolio.  This is what the Efficient Frontier methodology does for me.  The cost is not participating in the highest gains at a disproportionate risk level, but I sleep well.

Markets will most likely be up today, so I will most likely finish well above the +0.302% level, handedly beating the risk-free return of the G-Fund.  It doesn't always work out this way though.

==================

Remember, you are responsible for your own trading decisions, and I am not.  Please do your diligence, and please take ownership for your actions.

Regards,

pgd


Friday, April 15, 2011

Stay the Course on the Long Side

.
A question came in over night about "selling the bounces" and my short answer is that there is nothing in the TSP adaptive routines for the C-Fund, S-Fund, or I-Fund that indicates that I should move to cash.

Since my long signal on March 28 I have the following performance, with the suggested allocations:

  • C-Fund, 98% allocation, +0.429% gain
  • I-Fund, 1% allocation, +0.023% gain
  • S-Fund, 1% allocation, +0.009% gain
This configuration continues to exhibit the best return/risk allocations given the previous 100 days of volatility.  Yes, the I-Fund is up +2.313% since the signal, but the volatility swings are greater than 1.4% per day on average, and volatility is increasing, so my suggestion is to keep the suggested allocations (for now).  

I'm sitting pat, but of course, my crystal ball is as good as yours.  This could all change with today's action.

==================

Regards,

pgd


Sunday, April 10, 2011

Adaptive Timer Signals CASH on F-Fund

.
Summary

  • We are presently 100% LONG in the portfolio in the C-Fund, S-Fund, and I-Fund.  Gain since the last signal (March 28), at the target percentages, is +1.492%.  We peaked at a gain of 2.042% this past Wednesday, so we have given up -0.55%.  Contrasting, the S-Fund peaked at 3.677% and has dropped to 2.353%, a loss of -1.324%, and the I-Fund peaked Friday at 3.201%.  Note that these are weighted performance values, e.g., with the allocations in the next bullet.
  • Our portfolio allocations are 98% in the C-Fund, with 1% in the I- and S-Funds.  The allocation represents the best reward/risk on a short-term basis, and you see this volatility above in the 1st bullet.
  • The F-Fund has signaled a move to CASH.  You probably do not want any money in the F-Fund right now, and I never put any there.
  • While there are signs of a topping market, I see no compelling reason to move anything to cash.  If you're nervous, then go ahead, but for my particular circumstance, I'm sitting pat.
==============

Relative Market Volatility

I've presented the following graph numerous times over the last months -- it gives us a good view of the market as a whole in terms of volatility.  Generally, when short-term volatility is low, the VXX has a lower number than the longer-term VXZ, and the ratio rises.  A dropping VXX generally corresponds to an increasing market, in general.


The top graph is the SLOPE of the weekly moving average of the ratio VXZ to the VXX (these are ETFs -- look them up here to learn more about these specific entities).  The important thing is that the slope is positive AND it's pointing upward.  This really is all that you need to know.  If you want to bookmark this chart, here's the link.

The bottom graph is the ratio of the longer-termed volatility ETF VXZ to the shorter-termed volatility ETF VXX.  We see that the ratio has closed for 3 weeks above the 7w moving average, which I consider bullish for holding our funds.

Of course, this makes no representation as to what the following week will hold.  The markets could collapse, or they could move higher -- your crystal ball is as good as mine.  All I can say is that as of this writing that we need to be in the markets, and based on signals the last week of the month -- we are.

================

New CASH signal on F-Fund

I personally do not trade the F-Fund, but I track it.  As of the close of business Wednesday, April 6th, the GGT Adaptive Timer signaled a move to CASH for the F-Fund.  Note that this is calculated using the actual prices for the F-Fund, not on the ETF proxy that I sometimes use, AGG.  

If you are trading this fund, and again, I don't, but if YOU are, it probably is prudent to move to CASH.  The earliest you could have moved would have been Thursday night, and Friday's close was 0.9997 of Thursday's close, e.g., the same value for all intensive purposes.  Since our signal on March 28th the F-Fund has DROPPED -0.254%, but allocations were 0%, so if you had listened to me, you'd resisted any temptation to put money in the F-Fund.  :o)   -0.254% may not sound like a lot, but on $100K it's $254, which is a large number of Starbucks venti lattes.

================

Remember, you are responsible for your own trading decisions, and I am not.  Please do your own diligence, and please take ownership for your actions.

Regards,

pgd


Sunday, March 27, 2011

Confirmed Signal LONG for Monday, March 28

.
Summary

  • Volatility indicators are showing that we are early, but that the bulls are more powerful over the past week.
  • The TSP / GGT Adaptive Timer, which uses the raw price signals from www.tsp.gov in the calculations, has all holdings LONG.
  • The historical GGT timer has the VXF (proxy for the S-Fund) LONG, but the EFA (I-Fund) and SPY (C-Fund) are still in CASH. 
  • For Monday, March 28th, the GGT TSP portfolio will be transitioning LONG. This is an aggressive move, as not all timer methods are indicating that this is a good choice.
============

Volatility

Perceived volatility in the market, as measured by the ratio of the longer-termed anticipated volatility VXZ compared to the shorter-termed 30-day anticipated volatility VXX, has improved.  Here's the chart:


As with all my charts, right-click on it to open in a new window or tab.

In the chart above, which is linked here, we have the ratio of longer-termed volatility to that of short-termed volatility.  Increasing values of this ratio are considered shorter-termed bullish, and this is what the past week has delivered.

As you can see in the chart above, the ratio of VXZ:VXX has closed above the 7w moving average for the first time since the 2nd week of February, giving us reason to believe that we may be moving upward from here as far as the broad markets are concerned.  Because I have no knowledge of the right side of the graph for the next couple of weeks, we must take this preliminary signal as bullish for the market in general.

I note with some caution that this 7-week line will be tested going forward.  Observe the May-June 2009 sequence, where the 7-week line was penetrated or tested for nearly 8 weeks.  During this time you may recall that it was difficult to make money in the TSP funds.  Note though that the slope of the 7w line never went below 0, so we had confirming indications to remain long during this test/penetration of the 7w line.

Nearly 12 months later, in the June 2010 period, we closed consecutive weeks below the 7-week line, then above it for two weeks, then we straddled it for the next two weeks, shaking out the weak bulls.  Note that we were negative in terms of slope, but then, it moved back into positive territory in mid-June, giving us some confidence to stay long.  It took until after mid-August before we had consecutive weeks strongly closing above the 7-week line, which we all know in hindsight as bullish.  The slope of the 7w line was clearly positive, giving us confidence through the tough times of June/July/August.

The situation now is a bit different.  The slope of the 7w line is very negative, which means that short-term volatility has been large compared to anticipated longer-termed volatility, but it is pointing higher, meaning that short-term volatility is decreasing.  We are early in terms of a call to the long side, and until this line crosses into positive territory, this present signal is weak.  Hence, while the signal is long, we need to observe other signals to see if they can confirm a move to the long side.

===================

VIX Ribbon

The VIX Ribbon is an indicator that is available in TradeStation, and it basically is a set of different colored moving averages, all plotted on the VIX.  The VIX is the index on the anticipated short-term volitility of the S&P500, and the VXX noted above is an ETF that mirrors the VIX performance in daily change.

Here's the chart:


The rules for the VIX ribbon are easy:  when the VIX closes above the largest EMA, we have a sell signal, and when it closes below the lowest EMA, we have a buy signal.

As you can see in the graph above, I've plotted vertical lines on days that issued up or down signals.

The VIX ribbon is prone to whipsaws, so it cannot be used in isolation.  What is notable about this indicator is that we issued a BUY/LONG call with the close of markets on Wednesday, March 23rd, essentially confirming the VXZ:VXX indicator above.  This situation points us to a move LONG in the markets.

I note with a careful eye that the pattern established towards the 6/15/10 long call looks a lot like the sequence that we have at the present time.  We must be vigilant for a reversal of volatility upwards, much like what occurred between 6/15/10 - 6/24/10.

======================

TSP / GGT Adaptive Timer

I am using a modified worksheet that I received from Dan Chiswick in Florida to individually watch the different TSP funds in terms of timing.  This methodology uses adaptive moving averages, e.g. the length of the moving average "adapts" as the market conditions change.  The impact is that as volatility increases the timer increases the likelihood of moving to CASH.

This timer is either a really good timer, or a really bad timer, depending on your mental state.  For an example of where the timer worked well, the first sign of short-term weakness occurred with the C-Fund, which measures the S&P500, and this occurred with the close on 3/10/11.  This means that you would have had to pull the trigger to move to cash on 3/11 to perfectly time this signal, and in this case, it would have worked, as 3/11 was an up day and you would have exited happy.  The timer confirmed this weakness on 3/14, and it stayed in CASH until the close of Thursday, 3/24/11's action. Ideally, we would have moved long on Friday, 3/25/11, but weekly signals are good and generally do not cost us either way over the long term.

As an example of where the timer challenged you mentally, it has remained completely long through this whole down-draft for the S-Fund, which is the entire market WITHOUT the S&P500.  A good proxy for this is the ETF VXF, which is the Vanguard Extended Market.  Put another way, the C-Fund + S-Fund = the entire market, as a broad index.

As I stated above, the S-Fund remained completely LONG during this market downdraft, going from $22.8194 on 2/17 to a low of $21.468 on 3/16, or a drop of -5.92%.  This is less than the backtested drawdown of a tad over -9%, so as we were walking in that direction I was wondering whether the indicator was going to toggle or not.  Obviously, it did not, although I was completely in CASH based upon other conditions on/around 3/8/11.

The I-Fund, which tracks the EAFE index, moved to a theoretical CASH on 3/14, so again, theoretically, we would have moved in actual dollars on 3/15 close.  From the 2/18 peak of $21.2762 the 3/15 close was $19.5573, or a drop of just over -8%.  3/16 was the low point for all the funds, so we perfectly timed the bottom, which is a terrible thing in hindsight this time, but in the big picture, had the markets continued south, the C-Fund and I-Fund signals would have looked kike good timing indicators overall.

To recap.  According to the GGT Adaptive Timer method:
  • C-Fund, which tracks the S&P500, moved to cash on 3/10 and moved back long on 3/24.
  • I-Fund, which tracks the MCSI EAFE index, moved to cash on 3/14 and moved back long on 3/22.
  • S-Fund, which tracks the ex-S&P500 market, never transitioned to cash and is still long.
=======================

GGT TSP Timer Method

This final method is the grand-daddy of my methods but it uses ETFs, not the actual TSP funds to determine the timer signals.  Here's the most recent dashboard view:


The red/green data on the right side of the figure is the most recent data to the oldest (2-week-ago) data, from left to right.

What the figure shows us is that for the past two weeks, at least since 3/11/11, the SPY (GGT proxy for the C-Fund) has been in CASH.  In fact, the SPY moved to cash with the close of markets on 3/10/11.  Note that this is in contrast to the adaptive timer method discussed above, which does not use volume (this GGT Timer does use volume).

Next in line is the VXF (proxy for the S-Fund).  The VXF transitioned to CASH on 3/10/11, and on 3/21/11 it moved back long.  We see that on Friday it also confirmed this move long, with the "Affirmed Long" recommendation waving wildly at us.

EFA (proxy for the (I-Fund), transitioned to cash on 3/7/11 and was a small part of the rationale for moving the entire portfolio to CASH on 3/8.  As you can see above, it is presently in CASH.  This is in contrast to the adaptive timer method discussed above, and again, is because volume is really poor.

=======================

TSP Allocations

Here's the performance over the last month of the 4 proxies that I use for TSP funds:


As you can see, VXF (S-Fund) is up 0.14%, and EFA (F-Fund) is down -2.66% for the previous month (actually, the S-Fund is even at 0.00% for the period 2/28 - 3/25, and the S-Fund is down -3.35% for the same period).   The question now is the amount of allocations.

Brute-force and simple, the following are allocations for the 4-portfolio method using the most recent performance as an allocator for future performance:
  • C-Fund/SPY (26%)
  • F-Fund/AGG (31%)
  • I-Fund/EFA (9%)
  • S-Fund/VXF (34%)
Note that these weightings are based upon the performance of the past month and assume that the near future will resemble the past (not necessarily a good assumption, but it is a good starting point).  Using the past yearly history of daily volatilities, the expected return of the portfolio above with these allocations is about 7.1% with an expected volatility (fully invested) of about 10%.

Using some advanced mathematics, it's possible to improve on the balance above.  If you're interested in how to do this I can point you in the right direction to do this work yourself.  New allocations that optimize the reward/variance ratio (also known as the Sharpe Ratio) are as follows:
  • C-Fund/SPY (98%)
  • F-Fund/AGG (0%)
  • I-Fund/EFA (1%)
  • S-Fund/VXF (1%)
Note that this zeros the F-Fund/AGG -- this is because all we have is the past to evaluate where we have been, and over the last year of data, the F-Fund/AGG has seriously underperformed.  Hence, in the optimization, it gets no weight.

Also note that almost everything moves into the C-Fund/SPY.  While this may seem counter-intuitive, as heavily loading into the C-Fund/SPY would apparently increase risk, in fact, it is the combination above that minimizes risk for a given maximum return, which is our goal in the long haul.  The underlying issue is one of benchmark -- we have to optimize to something.  In this case I picked the S&P500, simply because it outperformed the Russell 2000, Nasdaq, and DJ30 over the past year.  Hence, the optimization answers the question "How do we outperform the portfolio compared to benchmark but not take on any more risk?".  The  balance above achieves this goal.

The graph of this variance vs. gain phenomenon is interesting:


The graph above shows the expected performance and volatility using allocations derived from the previous 30 days of data as a yellow diamond, and the optimized portfolio's expected return/volatility is shown with a purple diamond.  While there is more volatility in the new portfolio, there is more gain, which is what we expect and are after.  Although portfolios do exist (on the blue line, to be exact) that can provide higher gains at higher volatilities, none are as efficient as the purple diamond above.  Above the purple diamond, it is impossible to maintain the same rate of change in return/volatility, as volatility will increase faster than rate of return, or put another way, risk increases faster than return above the purple diamond.

 I personally do not play the F-Fund, as I think the tying up of dollars in this fund results in underperformance. Correspondingly, here are my non-optimized allocations for the 3-portfolio method:
  • C-Fund/SPY (38%)
  • I-Fund/EFA (13%)
  • S-Fund/VXF (49%)
Again, note that these weightings are based upon the performance of the past month and assume that the near future will resemble the past (not necessarily a good assumption, but it is a good starting point).  Using the past yearly history of daily volatilities, the expected return of the portfolio above with these allocations is about 10.7% with an expected volatility (fully invested) of about 16%.  

As you would expect, the 3-fund portfolio that was optimized above has the same optimal weightings here.  Here's a graph of expected volatility vs. gain for the 3-fund portfolio:


In the figure above, the previous month's data/allocations are shown as the yellow diamond, and the purple diamond represents the optimized allocation.  Note that the purple diamond is below the yellow diamond -- risk is higher with my proposed allocation using the last 30 days of data as a source, whereas the data of the past year suggests that the performance will be less.  No matter what the performance expectations, the purple diamond represents that portfolio which has the best return/volatility value, and above this value (on the blue line), volatility is increasing faster than gain.

Recap:  to best balance return/risk, the suggested allocation for Monday is:
  • I-Fund/EFA (1%)
  • C-Fund/SPY (98%)
  • S-Fund/VXF (1%)
It's obviously up to you to choose whatever allocation meets your ability to withstand volatility.

=========================

Trading Plan for Monday, March 28th

I intend to move from the G-Fund (cash) to the optimal allocations for a 3-fund portfolio as listed above.  Note that I'll make the request before 12:00, so that it is effective on the close Monday.

Regards,

pgd

Monday, March 14, 2011

March 11th Weekend Update

.
Given the recent market conditions, we moved to CASH in all portfolios as of the close of markets on 3/8.  This appears to be a good decision, as since this time we have lost the following amounts in the TSP funds:

  • C-Fund:  -1.28%
  • I-Fund: -2.40%
  • S-Fund: -1.98%
If you have not moved your monies to the G-Fund, I would seriously consider doing so, as there is nothing in the tea leaves nor in my crystal ball which shows that any form of reversal to the upside could be sustained.

As with all my images, right click on the picture to open in a new window or tab:


The image above shows a weekly view of expected long-term volatility (measured by the ETF VXZ) ratioed against the ETF VXX, which is the expected short-term (next 30 days) volatility.  We've now traded three weeks under the 7w simple moving average, and until we start seeing higher lows and higher highs, my mood is decisively bearish.  The markets are expecting that volatility will continue to increase the next 30 days at a rate faster than long term volatility, which generally is very bearish for our equity.

Cash is a very safe place to be for my wife's funds.

=======================

Regards,

pgd


Tuesday, March 8, 2011

Market Confirms Move to Cash

.
We're on the fence post, but are leaning to move to cash if you are conservative.  IBD confirmed last night that we are "in a correction", and another author I watch who blogs at the following site

http://blog.alphascanner.com/?p=402

has indicated in a private correspondence that the hedge funds are now confirmed as seen going through the exit doors.  Furthermore, money flow, as indicated by Effective Volume, is confirmed to be on the outflow side, with the following commentary from the creator of EV:

"Yesterday, at the close, the 20DMF [20 day money flow indicator] issued a short signal that was confirmed by the inversed ETFs. When such a signal is issued, the best is to find [the] weakest stocks in the list of sectors with the weakest price RS [relative safety]. However, still avoid shorting PM [precious metals] related sectors, as this sector is behaving rather differently from traditional sectors."


Contrasting with this are two primary indicators that guide most of my decisions still are "more bullish than bearish".  One is the GGT signal, which compares a stock price with historical levels to get a feel for performance, and the other is an adaptive moving average signal, which is applied individually to each of the actual TSP funds pricing data (not to ETFs).  In both cases each of these signals is still long, weak to be sure, but still long.  Hence, while we have very credible signals all around, we're not seeing a huge "everybody hit the exit doors at once" type of scenario.

So, we are presented with a dilemma. If we move our funds to cash today, we are safe, but we will miss out on any moves upward.  We will burn one of our two moves that we get in the TSP this month.  If we remain invested, we are certainly have downside risk that could expose us to loss of equity.  We also will retain our ability to transfer monies this month.  It's early in the calendar for the month, and we have to weigh whether the upside potential is greater than downside potential (it's even at best), whether any correction will be short lived, if it occurs (your crystal ball is as good as mine), and whether we want to ride out March largely in Cash.

If you are a conservative investor, it may be prudent for you to move 100% to cash, as we have confirmation from credible sources of an orderly flight to safety vehicles, making support of equity investments a tenuous proposition for the next week or two.  Likewise, if you are an aggressive investor, it may be prudent to move a major portion of your funds to cash, but leave some in play, to participate in any rally that could initiate from here.


Given my wife's timetable for retirement, I fall more on the aggressive side, but given that we've not moved anywhere on the upside over the past month, the reward/risk ratio is very poor from my point of view.  So while I'm aggressive, I intend to move to cash with my conservative friends.

=================

Remember, you are responsible for your own trading decisions, and I am not.  Please do your own diligence, and please take ownership for your actions.

Regards,

pgd

Friday, March 4, 2011

AGG / F-Fund Confirms CASH Position

.
With the close of markets on Thursday, March 3rd, the F-Fund and the ETF AGG are both confirming a move to CASH.   GGT already has had these sitting in CASH, but another model I use to independently arrive at the same conclusion strongly confirms that you should not be in this bond fund at the present time.

On a related note, GGT has the ETF SPY, which is the S&P500, as recommending CASH.  The other model I use, which does not consider volume, has the C-Fund completely LONG.  GGT has the SPY in CASH because of the lack of volume, compared to historical strength, and is suggesting that we hold no positions in the SPY.

Whether this is prudent advice or not will reveal itsself in the next couple of weeks.

==================

Remember, you are responsible for your own trading decisions, and I am not.  Please do your diligence and take ownership for your actions.

Regards,

pgd